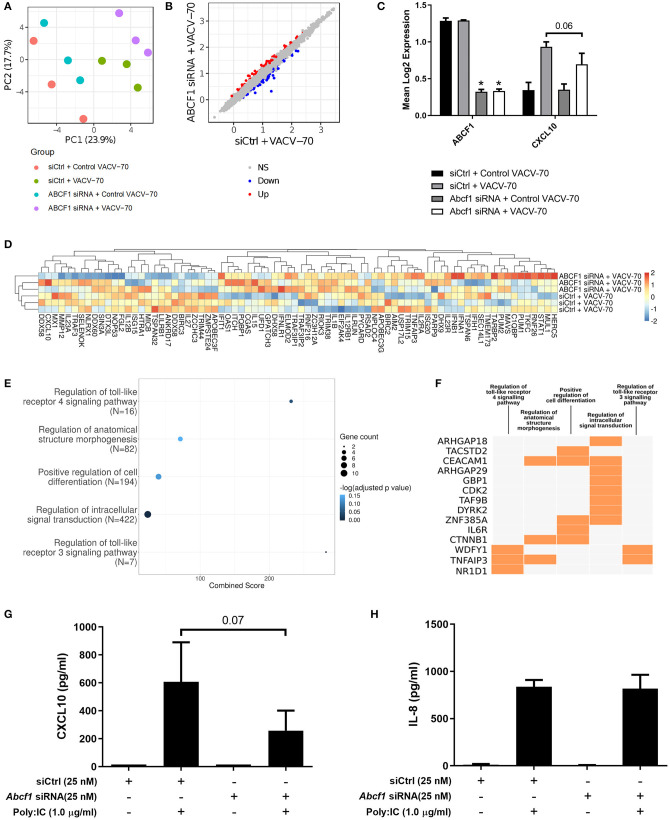
Figure 6.
Transcriptional interrogation of ABCF1 function during VACV-70 challenge in HBEC-6KT. (A) PCA plot of microarray gene expression profiles of HBEC-6KT cells following ABCF1 knockdown and VACV-70 treatment. Red circles (control siRNA and control VACV-70), green circles (control siRNA and VACV-70), blue circles (ABCF1 siRNA and control VACV-70), purple circles (ABCF1 siRNA and VACV-70). (B) Log2 expression data for transfection treatment with ABCF1 siRNA and VACV-70 compared to control siRNA and VACV-70. Significantly differently expressed genes are identified in blue (down−65 genes) and red (up−63 genes). (C) Confirmation of ABCF1 and CXCL10 attenuation with ABCF1 siRNA treatment presented as log2 expression data. Black bars: control siRNA and control VACV-70, light gray bars: control siRNA and VACV-70, dark gray bars: ABCF1 siRNA and control VACV-70, white bars: ABCF1 siRNA and VACV-70. (D) Heat map of log2 expression data (scaled by gene) of genes associated with the “regulation of defense response to virus” GO term (n = 68) plus the selected known antiviral genes from Figure 3E (n = 11) for VACV-70 samples with and without ABCF1 siRNA. (E) Top 5 GO Biological Processes are ranked by increasing –log10 adjusted p-value, with number (Count) of significantly differentially expressed genes between VACV-70 samples with and without ABCF1 siRNA, contributing to the total number of genes associated with the given pathway (N) denoted by the size of circle. (F) Significantly differentially expressed genes between VACV-70 samples with and without ABCF1 were submitted to Enrichr for generation of a clustergram defining the gene contribution (Y-axis) to the functional enrichment of the top 5 GO Biological Processes (X-axis), with orange squares denoting the association of a differentially expressed gene with a particular GO term. (G) Poly I:C (1.0 μg/ml)-induced CXCL10 and (H) IL-8 secretion for HBEC-6KT cells with ABCF1 siRNA treatment. All studies n = 3; *p < 0.05.

