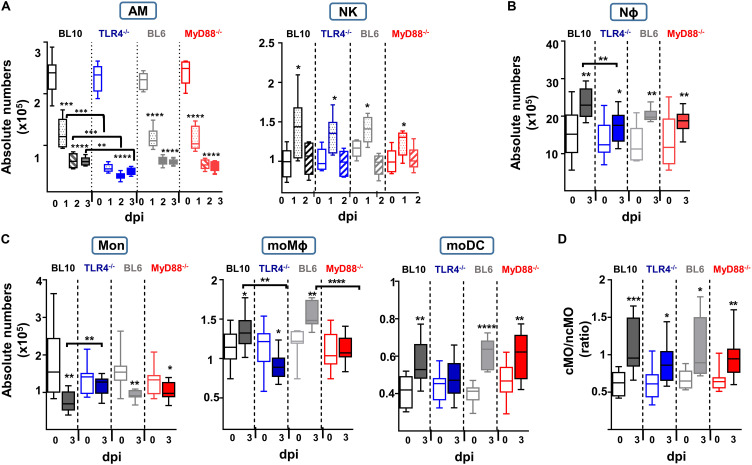
FIGURE 3.
Quantification of the absolute numbers of different lung innate subsets after S. pneumoniae (2 × 10⁶ CFUs) instillation to WT.BL10, TLR4–/–, WT.BL6 and MyD88–/– mice. (A) AM and NK cells were identified and counted at 0, 1, 2, and 3 dpi. Absolute numbers were calculated using the frequencies obtained by cytometry and the total number of cells counted in each sample: WT.BL10 (n = 6), TLR4–/– (n = 6), WT.BL6 (n = 6), and MyD88–/– (n = 6) at 0, 1, 2, and 3 dpi. (B–D) At 3 dpi the IIR was analyzed by quantifying the Nϕ cells, monocytes, the moDC and moMϕ cells, and the cMO and ncMO populations from control and infected mice. Box-and-whisker plots show the median values, with the bottom and top of the box indicating the first quartile to the third quartile, with the minimum and maximum values from four independent experiments: WT.BL10 (n = 12), TLR4–/– (n = 15), WT.BL6 (n = 6), and MyD88–/– (n = 15). All the populations were analyzed by one-way ANOVA and with an unpaired two-tailed Student’s t-test: *p < 0.05, ** p < 0.01, *** p < 0.001, **** p < 0.0001.

