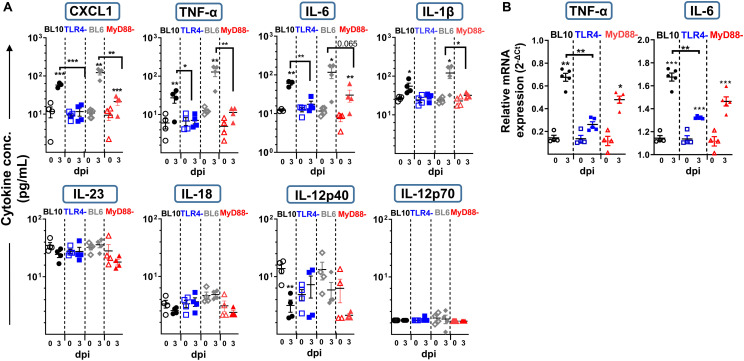
FIGURE 4.
Lung cytokine production at 3 dpi in WT.BL10, TLR4–/–, WT.BL6 and MyD88–/– S. pneumoniae (2 × 10⁶ CFUs) infected mice. Lung suspensions from control (empty symbols) and infected mice (filled symbols) were prepared and their supernatants analyzed. (A) CXCL1, IL-18, IL-23, IL-12p70, IL-6, TNF-α, IL-1β, and IL-12p40 protein levels were measured in LEGENDplex Cytokine Assays. (B) TNF-α and IL-6 gene expression in the lungs of WT.BL10, TLR4–/–, and MyD88–/– measured by qPCR at 3 dpi using the Bio-Rad CFX Manager software to calculate the CT for each reaction. The amount of each specific transcript in each cDNA sample was determined and expressed as the 2–ΔCT, relative to that of HPRT transcripts. The data are shown as in Figure 1B, representing 4-to-6 different samples evaluated in duplicate. The populations were compared with one-way ANOVA and with an unpaired two-tailed Student’s t-test: *p < 0.05, ** p < 0.01.

