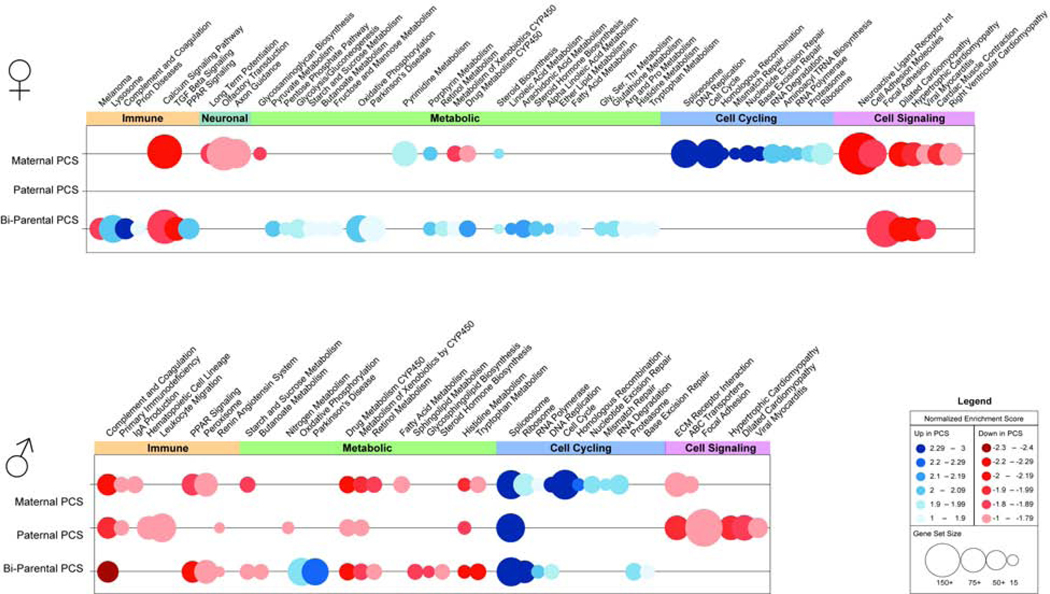
Figure 2.
Maternal preconception stress shapes the offspring fetal brain transcriptome. Bubble plots of gene sets identified by gene set enrichment analysis (GSEA) as significantly altered in fetal brains of female (top) and male (bottom) offspring of maternal (n=3), paternal (n=2), and bi-parental (n=6) PCS relative to controls (n=3). Bubbles represent the normalized enrichment score (NES) of a particular gene set, where color indicates increased (blue) or decreased (red) enrichment, color intensity indicates magnitude of change, and bubble diameter represents gene set size. Differentially enriched gene sets, meeting criteria of FDR ≤ 0.0025 p ≤ 0.01, and NES ≥ 1.6, were grouped into functional categories spanning immunity (red), metabolism (green), cell cycling (blue), and cell signaling (purple). Gene set enrichment analysis (GSEA) of placentas at embryonic day 12.5 (E12.5) indicated a marked decrease in gene expression in placentas of male PCS offspring relative to controls, specifically in genes mediating immune Supplementary Tables 3 and 4.

