

Abstract
Background.
Cooks exposed to biomass fuel experience increased risk of respiratory disease and mortality. We sought to characterize lung function and environmental exposures of primary cooking women using two fuel-types in southeastern India, as well as to investigate the effect of particulate matter (PM) from kitchens on human airway epithelial (HAE) cells in vitro.
Methods.
We assessed pre-and post-bronchodilator lung function on 25 primary female cooks using wood biomass or liquified petroleum gas (LPG), and quantified exposures from 34 kitchens (PM2.5, PM <40 μm, black carbon, endotoxin, and PM metal and bacterial content). We then challenged HAE cells with PM, assessing its cytotoxicity to small-airway cells (A549) and its effect on: transepithelial conductance and macromolecule permeability (NuLi cells), and antimicrobial activity (using airway surface liquid, ASL, from primary HAE cells).
Results.
Lung function was impaired in cooks using both fuel-types. 60% of participants in both fuel-types had respiratory restriction (post bronchodilator FEV1/FVC>90). The remaining 40% in the LPG group had normal spirometry (post FEV1/FVC=80–90), while only 10% of participants in the biomass group had normal spirometry, and the remaining biomass cooks (30%) had respiratory obstruction (post FEV1/FVC<80). Significant differences were found in environmental parameters, with biomass kitchens containing greater PM2.5, black carbon, zirconium, arsenic, iron, vanadium, and endotoxin concentrations. LPG kitchens tended to have more bacteria (p=0.14), and LPG kitchen PM had greater sulphur concentrations (p=0.02). In vitro, PM induced cytotoxicity in HAE A549 cells in a dose-dependent manner, however the effect was minimal and there were no differences between fuel-types. PM from homes of participants with a restrictive physiology increased electrical conductance of NuLi HAE cells (p=0.06) and decreased macromolar permeability (p≤0.05), while PM from homes of those with respiratory obstruction tended to increase electrical conductance (p=0.20) and permeability (p=0.07). PM from homes of participants with normal spirometry did not affect conductance or permeability. PM from all homes tended to inhibit antimicrobial activity of primary HAE cell airway surface liquid (p=0.06).
Conclusions.
Biomass cooks had airway obstruction, and significantly greater concentrations of kitchen environmental contaminants than LPG kitchens. PM from homes of participants with respiratory restriction and obstruction altered airway cell barrier function, elucidating mechanisms potentially responsible for respiratory phenotypes observed in biomass cooks.
Keywords: India, biomass, particulate matter, respiratory disease, airway epithelial cell barrier integrity
1. INTRODUCTION
A primary cause of respiratory morbidity worldwide is Chronic Obstructive Pulmonary Disease (COPD), a syndrome characterized by progressive lung function decline, (Rabe et al., 2007) and typically defined by spirometry measures. Although historically, COPD has been thought to primarily affect smokers, it has recently been proposed that exposure to particulate matter (PM) from biomass fuels worldwide may be the largest risk factor for developing COPD (Salvi & Barnes, 2010; Vogelmeier et al., 2017). For example, among non-smokers in seven studies, the odds ratio (OR) for developing COPD is 2.55 (95% confidence interval 2.06–3.15) in biomass exposed individuals, and the risk increases among smokers (Hu et al., 2010). Additionally, for non-smoking Indian women, the rate of COPD is comparable to that of Indian men, who commonly smoke cigarettes, (Jindal, Aggarwal, & Gupta, 2001) and globally, women and men now experience similar rates of COPD, once disproportionately affecting men (World Health Organization, Chronic respiratory diseases: Burden of COPD). Therefore, COPD risk is likely driven by factors other than cigarette smoking, including exposure to cook-stove smoke.
The term biomass refers to fuel from any recently living organic matter, such as agricultural residue, wood, and dung. Dung is used throughout the north-and southeastern border of India, crop residue is used intermittently country-wide, while wood is used throughout the country (Reddy & Venkataraman, 2002). Of biomass fuels, wood-smoke is particularly toxic – not only does it increase the risk of COPD, but exclusive wood-fuel use also increases the risk of developing other major respiratory diseases (acute and chronic lower respiratory infections, death due to respiratory causes) compared to clean fuel, coal, or mixed fuels (Chan et al., 2019), and wood biomass is the primary fuel source in Thanjavur, Tamil Nadu, India (personal observation).
Emissions generated during biomass burning that are potentially responsible for health effects have been studied (Assad, Kapoor, & Sood, 2016; Dills, Zhu, & Kalman, 2001; Jenkins, Jones, Turn, & Williams, 1996) and epidemiological research has long identified combustion particles <2.5 μm in aerodynamic diameter (PM2.5) as deleterious to respiratory health, (Horne et al., 2018; Ni, Chuang, & Zuo, 2015; Pope III et al., 2002; Xing, Xu, Shi, & Lian, 2016). However, wood biomass emissions from this region has not been carefully characterized for related health effects. While PM2.5 is a major source of exposure from biomass cooking, the burning of solid fuel also generates other important noxious byproducts and respiratory irritants (Gordon et al., 2014; Jenkins et al., 1996; Semple et al., 2010). Black carbon (BC), a byproduct of incomplete combustion and short-lived climate pollutant, plays an important role in climate change and is strongly associated with adverse respiratory health effects, with potentially greater health effects per unit mass than PM2.5 (Janssen et al., 2011; Janssen & Joint, 2012; Tobias et al., 2014). Additionally, combustion particles contain heavy metals that can act as lung irritants. For example, exposure to PM2.5 with higher nickel (Ni), arsenic (As), chromium (Cr), and bromine (Br) levels increases the risk of hospital admission, and smokers and patients with COPD tend to have higher iron (Fe) content in their bronchoalveolar lavage (Ghio et al., 2008; Zanobetti, Franklin, Koutrakis, & Schwartz, 2009). Lastly, bioaerosols and organic content (e.g. endotoxin, organic carbon (Zanobetti et al., 2009)), released during biomass burning (Semple et al., 2010), leads to inflammation and decreased lung function (Castellan, Olenchock, Kinsley, & Hankinson, 1987; Schwartz et al., 1994; Semple et al., 2010; Tockman & Baser, 1984; Vogelzang et al., 1998; Zanobetti et al., 2009).
Because women are typically the primary cook in India, and COPD risk increases (180%) alongside solid-fuel use, (Kurmi, Semple, Simkhada, Smith, & Ayres, 2010) we sought to assess the lung function of cooks using different fuels (liquified petroleum gas (LPG), or wood), with the hypothesis that women using wood fuel will have impaired lung function. Accompanying this hypothesis, we sought to characterize aerosols generated during cooking in kitchens using wood biomass, compared to that generated using LPG, expecting that alterations in lung function would be related to the cooks’ kitchen environment. To accomplish this, we established an interdisciplinary team of investigators to study lung disease in Thanjavur (Tamil Nadu), India, to evaluate the pulmonary function of primary cooking women, and assessed kitchen air quality. After field work was completed, we tested PM collected from kitchens on human airway epithelial (HAE) cells in our lab to ascertain whether PM from different kitchens had differential effects in vitro.
2. MATERIAL AND METHODS
2.1. Study population
We established a collaboration with Periyar Maniammai Institute of Science & Technology (PMIST) in Thanjavur, India. PMIST faculty reached out to local communities with known biomass use and communicated with those who expressed willingness and completed written consent to participate in our study. The study was carried out within 20 km of Thanjavur, India. We recruited self-reported healthy participants with no history of lung disease from homes that used wood biomass or LPG. All participants were consented for spirometry and computed tomography (CT). The work described in this article has been carried out in accordance with The Code of Ethics of the World Medical Association (Declaration of Helsinki) for experiments involving humans, the EC Directive 86/609/EEC for animal experiments, and the Uniform Requirements for manuscripts submitted to Biomedical journals. This study was approved by the Institutional Review Board (IRB) at the University of Iowa, the IRB at PMIST, and by the government of India’s Indian Council of Medical Research. Participants were given a survey regarding their cooking and personal history, Table S1.
Ours was a blinded study with post-hoc spirometry grouping. The respiratory therapist was blinded to the fuel-type of participants in order to avoid introducing a bias that could affect spirometry coaching (despite it being a standardized procedure). Spirometry grouping was post-hoc because spirometry values were unknown during data acquisition. In the communities we visited, there were far fewer cooks using LPG fuel than biomass and recruitment was therefore more difficult (personal observation). Because of this, we feel the ratio of participants using LPG and biomass in our study was representative of those within the communities studied. While our sample size is small, our study was a pilot, carried out to help us understand the effect size, range of individual responses, and feasibility of collecting extensive data from each home. Additionally, we wanted to address referral, recruitment, and retention rates, and our small sample allowed us to do this. Lastly, the size of the samples for LPG and biomass was determined by the willingness to participate in our study and availability of different fuel-types (few LPG users within the communities). Study participation was voluntary during a limited enrollment period.
2.2. Spirometry
Spirometry was performed on participants from homes using primary biomass (n=20) and LPG (n=5) fueled stoves. Participants were coached through the pre- and post-bronchodilation lung function tests (National Pharma Hospital and Research Institute, Thanjavur, India). For post-bronchodilator spirometry, subjects received 200 μg of salbutamol. Lung function values are reported based on European Respiratory Society (ERS93) adult predicted values (Quanjer et al., 1993); however, because lung function is lower in Asian Indians (~20–25%) when using ERS predictive values, (Fulambarker, Copur, Javeri, Jere, & Cohen, 2004) we present the FEV1/FVC ratio post-bronchodilator, to correct for race and ethnicity effects. Additionally, we assessed participants’ lung function using CT imaging, post-bronchodilation. The analysis of these parameters is ongoing.
2.3. PM2.5
We measured daily PM2.5 concentrations in primary kitchens for one week in March 2019 using a personal sampler with a size-selective inlet (Ultrasonic Personal Aerosol Sampler, UPAS, Access Sensor Technologies, Ft. Collins, CO, USA), collecting filters for gravimetric analysis. We also used a direct reading instrument (DRI), the Particle and Temperature Sensor (PATS+, Berkeley Air, Berkeley, CA, USA) to capture short-term excursions (Figure 1A and 1D).
Figure 1. Measurement design.
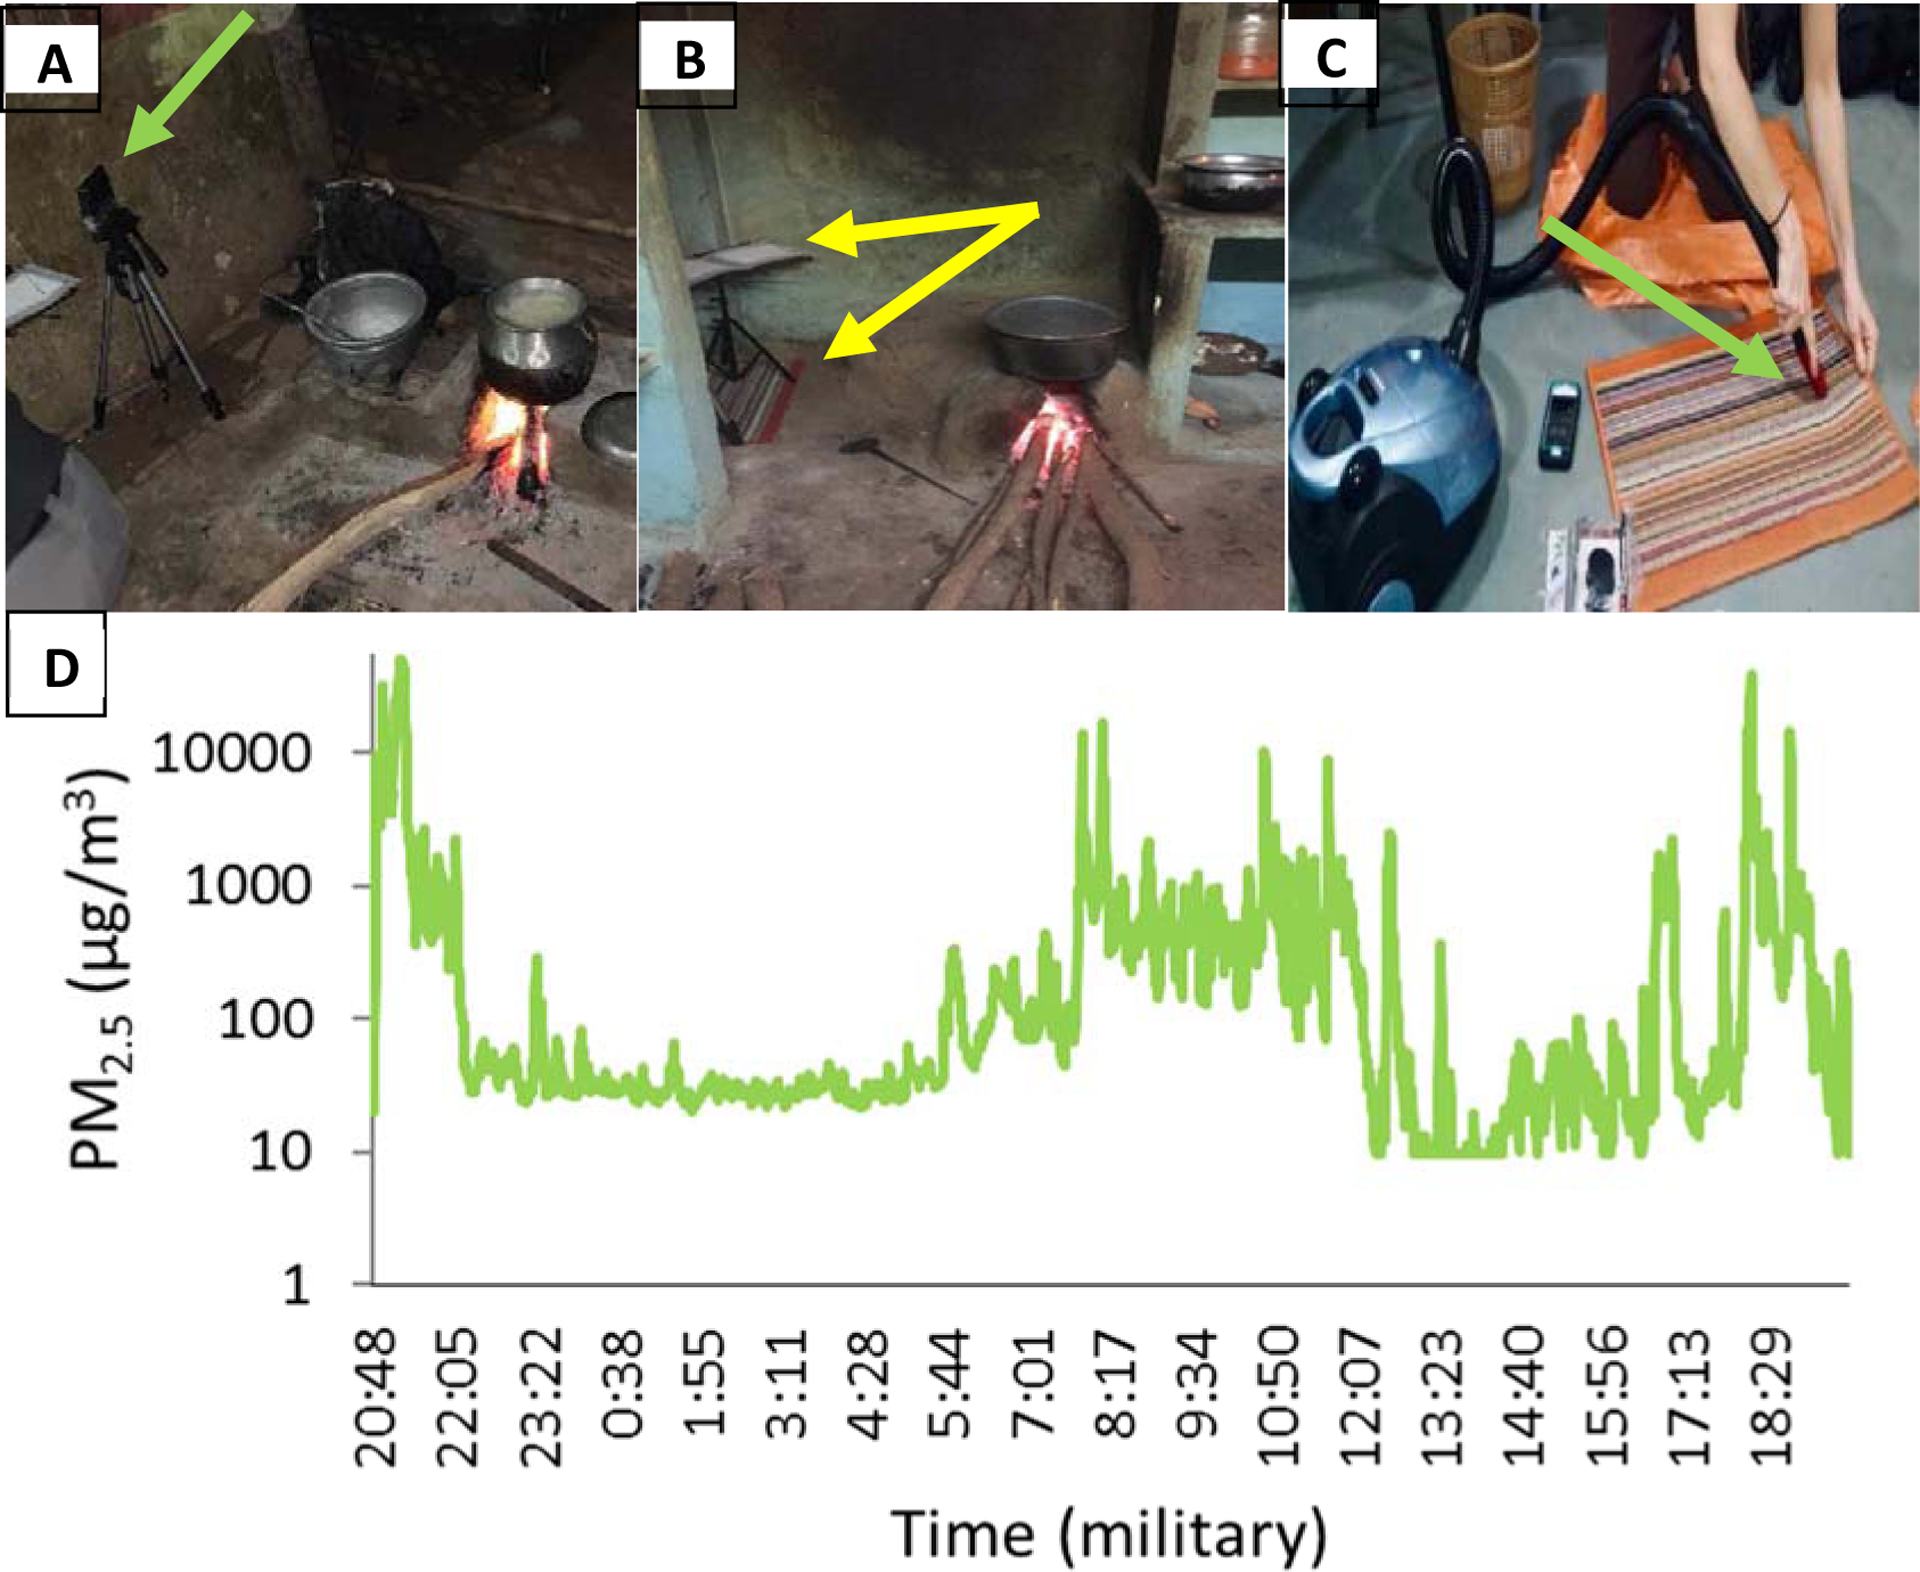
A. PM2.5 measurements were conducted at approximate cooking height near the cookstove, arrow indicates device colocation B. EDCs collected endotoxin on a music stand (top arrow), while PM settled on pre-cleaned rugs below the EDC (bottom arrow) for 7 days C. Rugs were vacuumed into a sieve (arrow), collecting particles <40 μm D. One representative PM2.5 daily time series from biomass home in log scale – peaks occurred during evening and morning hours, corresponding with typical times of evening meals, breakfast, and tea. Peak exposure exceeded 50 mg/m3, indicating extremely high peak concentrations.
We adjusted UPAS flow before and after each field measurement using a field-portable mass flow meter (m/n 41401, TSI, Shoreview, MN), which was calibrated to a triCal (BGI by Mesa Labs, Butler, NJ, USA) airflow calibrator. We collected three field blanks, placed in a filter cassette and exposed to the field environment; however, no airflow passed over the filters. We cleaned PATS+ optical sensors each sampling day. Both UPAS and PATS+ devices were collocated on a tripod within the cooking zone (0.7–2.7 m to stove), and at the approximate breathing area of cooks (0.9 m). The PATS+ sampling inlet was 90° from the UPAS air outlet, Figure 1A. Individual UPAS (n=10) and PATS+ (n=10) devices were always paired.
We collected PM2.5 mass on polytetrafluoroethylene (PFTE) 37 mm filters (Measurement Technology Laboratories, Minneapolis, MN, USA), then stored filter cassettes in an airtight plastic bag placed in an amber glass jar to prevent light infiltration. We post-weighed filters within 3 weeks of sampling, after a 24 hr equilibration period (in a temperature and relative humidity control chamber), and static removal (NRD 1U400, Grand Island, NY, USA). We weighted filters on a calibrated 1 μg resolution microbalance (Mettler Toledo XP26, Mettler Toledo, Columbus, OH, USA) and calculated mass concentrations by dividing filter mass by air volume sampled (corrected to the triCal airflow calibrator). Filter light absorption coefficients (Fabs), a proxy of BC, were determined by an image-based reflectance method, previously published (Jeronimo et al., 2020). Filter analysis was completed at the University of British Columbia, Canada. Balance accuracy was confirmed using lab-blank filters (SD <0.01), and field filter accuracy was confirmed using field filter blanks (9% of samples, variability <5%).
2.4. Vacuumed PM
Because the female cooks, especially those using biomass, cooked very close to their ground-level stove, we collected particles near the cooking area from identical clean, rubber-backed rugs (40 × 60 cm2) placed on the kitchen floors. This allowed us to collect particles beyond those in the combustion range, but also enabled us to collect heterogenous particles from each kitchen, which we later used to study biological effects on airway epithelia.
We vacuumed new, clean rugs prior to placing them in kitchens, and collected two “rug blanks,” by vacuuming any remaining material using a nylon mesh filter (DUSTREAM® collector, Indoor Biotechnologies, Charlottesville, VA, USA) after the initial vacuuming, and prior to rug deployment. Rugs were placed in the kitchen area near the stove and under the music stand holding the electrostatic dust collector (EDC), Figure 1B. After one week, the rug was removed and stored in a clean plastic bag (no longer than 24 hours) until it was removed and vacuumed for one minute using the DUSTREAM® collector, Figure 1C. PM samples were stored in pre-weighed glass amber jars (Thermo Scientific™, Waltham, MA, USA) and weighed (Mettler Toledo XPE206 Delta Range, Columbus, OH) in a relative-humidity and temperature-controlled room within two weeks of collection, after which they were stored in a nitrogen tank to prevent oxidization.
For microbiological analysis, recently collected PM was suspended in UltraPure™ distilled water, (Life Technologies™) at a 1 mg/mL concentration. Standard microbiologic techniques were utilized to identify and quantify bacteria present in PM. For additional details regarding microbiologic methodology, see Supplemental Methods.
2.5. Chemical composition and particle charge
We measured metal content of vacuumed PM using a Niton™ XL3t XRF Analyzer (Thermo Scientific™, Waltham, MA, USA). After each reading, samples were removed, mixed, and re-read. Data were transferred using the Niton Data Transfer (NDT™) PC software. The average of triplicate values was then corrected for the average rug-blank metal content. 37 mm filter samples were treated identically, however, the settings were modified (thin film mode employed).
To assess the charge state of the particles, we tested the zeta potential from biomass (17) and LPG (5) kitchens from which we had PFTs and PM. We transferred PM using antistatic spatulas (VWR, Radnor, PA, USA) into glass vials (Opticlear®, Kimble Chase Life Science, Rockwood, TN, USA). PM was suspended at 100 μg/mL in UltraPure™ distilled water. Particle zeta potential was read in triplicate (Zetasizer nano ZS, Malvern Panalytical Ltd, Malvern WR14 1XZ, United Kingdom).
2.6. Endotoxin
We measured endotoxin by placing an electrostatic dust collector (EDC) (Kilburg-Basnyat, Metwali, & Thorne, 2014; Noss et al., 2008) on a music stand (Kilburg-Basnyat, Peters, Perry, & Thorne, 2016) in the kitchen for 24 hrs, then repeated with a clean EDC for the following 7 days, Figure 1B. Subsequent analysis was performed at the University of Iowa Human Toxicology and Exposomics Laboratory with extraction into Tris-EDTA and using the kinetic chromogenic Limulus amebocyte lysate assay as previously described (Hoppe Parr et al., 2017). For additional details regarding endotoxin methodology, see Supplemental Methods.
2.7. In vitro assays
2.7.1. Cytotoxicity of PM on human airway epithelial A549 cells
In order to test whether the vacuumed PM is toxic to human lung cells, we exposed PM to an A549 human airway epithelial (HAE) cell-line (ATCC® CCL-185™, Manassas, VA, USA), and measured release of lactate dehydrogenase (LDH). First, we passaged the 80% confluent HAE cell-line at 4,000 cells/well onto 96-well cell culture plates in 100 μL of cell culture media (1:1 GIBCO Dulbecco’s Modified Eagle Medium (DMEM)/F-12, 10% fetal bovine serum, 1% penicillin streptomycin, Thermo Fisher Scientific Waltham, MA, USA) and incubated the cells (37°C, 5% CO2 enriched incubator). 24 hours post-seeding, we changed the media to a “starvation” media, to replicate biological conditions (DMEM, +1% Penicillin-Streptomycin, 0.1% Gentamicin and 1% Bovine Serum Albumin, Thermo Fisher Scientific Waltham, MA, USA), and incubated the cells overnight. Next, we applied the vacuumed PM (sonicated using Bransonic® Ultrasonic Baths model 1510, Thomas Scientific, Swedesboro, NJ, and suspended in starvation media) from all homes with spirometry and PM (n=22) to the starved A549 cells in a dose-dependent manner (dosefinal = 4.7, 9.4, 18.8, 37.5, 75, 150, 300 μg/cm2). The final dose was calculated from the mass by the surface area of the well. A particle control (volcanic ash) was applied in tandem, and treated cells were left overnight (17 hours) in the incubator.
The following morning, we followed the CyQUANT™ LDH Cytotoxicity Assay (Thermo Fisher Scientific, Waltham, MA, USA) protocol and optical density was read at 490 and 680 nm. Percent cytotoxicity was determined using the following:
Where spontaneous LDH release was the LDH content released from untreated controls, and the maximum LDH was from lysis buffer-treated cells (45 minutes). For additional details regarding A549 methodology, see Supplemental Methods.
2.7.2. Transepithelial conductance of passaged HAE cells at an air-liquid interface
We tested whether PM altered transepithelial conductance of a HAE cell-line (NuLi), (Zabner et al., 2003) passaged at 80% confluency and cultured at the air liquid interface (ALI). Briefly, HAEs from normal lungs were seeded onto 0.3 cm2 collagen-coated plastic inserts (type VI) (Zabner et al., 2003) within 24-well culture plates at a density of 264,000 cells/mL (120,000/cm2), (Molina et al., 2015) where they remained for 30 minutes in a CO2 enriched 37°C incubator without basolateral media, after which 400 μL cell-culture media (Karp et al., 2002) was added to the basolateral side. After 24-hours, apical media was aspirated, and basolateral media maintained (changed every 2 days). Once cells were differentiated on the substrate (~3 weeks), confirmed by transepithelial resistance, we added 100 μL apical vehicle and read baseline transepithelial electrical resistance (TEER) using an ohm meter (EVOM2, Sarasota County, FL, USA). After applying PM (dosefinal=30 μg/cm2) and FITC (dosefinal = 4 mg/mL), cells were incubated overnight. After 24 hours, we acquired post-treatment TEER and calculated electrical conductance (1/TEER) normalized to 1 cm2.
2.7.3. Permeability of low-molecular-weight FITC-conjugated dextran in HAE cells at ALI
To determine whether exposure to vacuumed PM altered barrier integrity of HAE cells at ALI, we added 25 μL FITC dextran (FITC-D, dosefinal = 4 mg/mL) average mol wt 4,000 kD (Sigma Aldrich, Saint Louis, MO, USA) suspended in cell media enriched with antibiotics (+0.1% fluconazole, 0.05% amphotericin B) to the apical side of the NuLi ALI cell cultures (conditions described above) to reduce the risk of contamination from colonized, non-sterilized PM. The 100 μL apical vehicle described above was removed prior to applying the FITC-D. 25 μL PM in vehicle (dosefinal=30 μg/cm2) was also applied to the apical side. Controls (n=3) were treated identically, however, without PM. After 24 hours, we removed basolateral media and FITC-D concentration was confirmed using a calibration curve. FITC-D fluorescence was measured at 485 nm (excitation) and 530 nm (emission), and permeability was calculated using a previously determined method (Forbes & Ehrhardt, 2005). 50 μmol egtazic acid was used as a positive control.
2.7.4. Antimicrobial activity of primary HAE cells
Next, we collected airway surface liquid (ASL) using warm DI H20 from primary HAE cells (20 μL/well), of three lung donors (obtained from the University of Iowa Cell Culture Core, approved by the University of Iowa IRB). Cells were seeded onto 0.3 cm2 collagen-coated plastic inserts (type VI) (Zabner et al., 2003) in 24-well culture plates, once complete differentiation reached (>21 days), at a seeding density of 200,000 per filter (Karp et al., 2002). Using methods previously described, (Stapleton et al., 2019) we exposed ASL to PM from 19 homes (dosefinal=100 μg/mL) and applied a bacterial challenge using bioluminescent Staphylococcus aureus (Caliper Lifesciences Bioware®). To assess the effect of PM on immediate bactericidal activity of the ASL, we compared the percent of live bacteria remaining after 10 minutes to the percent of live bacteria of untreated ASL.
2.8. Statistical analysis
For statistical analysis, we used GraphPad Prism v8 (San Diego, CA, USA) and significance was determined at α ≤ 0.05, unless otherwise stated. To test whether UPAS and PATS+ devices were correlated, UPAS PM2.5 and Fabs were correlated and/or 24-hr and 7-day endotoxin were correlated, we used a simple linear regression.
Lung function data are presented as mean and standard deviation, however, if data are not normally distributed based on the Shapiro-Wilk normality test, we used a Mann-Whitney U test, and if they were normally distributed, we used an unpaired t-test to determine significance. PM2.5 (μg/m3), Fabs, 37 mm filter Potassium and Iron (μg/filter), 24 hour and 7-day Endotoxin (EU/m2), bacteria (CUFs/mL) and rug mass (mg) data were tested for normality using the Shapiro-Wilk test. We determined 56% of LPG measurements were normally distributed and 13% of biomass measurements were normally distributed; however; once data were log-transformed, they were normally distributed in ≥75% of instances for both fuel-types. Therefore, we present geometric mean (GM) and geometric standard deviations (GSD). All p-values testing for differences between fuel-types for these concentrations were generated using the Mann-Whitney U test.
For vacuumed PM metal content data, >84% of values were normally distributed upon log-transformation, therefore we present GM and GSDs for all metal data. However, some elements were normally distributed before log-transformation. If values were normally distributed in both fuel-types (pre-transformation) using the Shapiro-Wilk normality test, we then used unpaired t-tests to determine significance between groups, while if metal content from either biomass or LPG kitchens were not normally distributed, we used Mann-Whitney U tests. In vitro data were tested for normality, and unpaired t-tests or Mann-Whitney U tests were applied, depending on Shapiro-Wilk normality results.
3. RESULTS
3.1. Sample Recovery
32 viable UPAS samples were collected from 34 homes (two were removed due to flow malfunctions) and daily PM2.5 collection time ranged from 19–24 hours. PM from rugs was recovered from 30 homes. We carried out pre- and post-bronchodilation spirometry on 25 participants (5 primary LPG cooks and 20 primary biomass cooks). Of these homes, 17 biomass and 5 LPG homes had both spirometry and vacuumed PM. To compare Fabs to PM2.5, filters with a mass >400 μg were excluded from the correlation analysis (n=3), because Fabs is sensitive to filter loading.
3.2. Study population
Of the 25 participants with spirometry, 23 completed a survey regarding cooking history and demographics. Participants using LPG and biomass were of similar age, had similar years spent cooking, and similar within-home animal entry. However, participants in the biomass group were more likely to work outside the home (e.g. agriculture and sweeping work, p<0.01), Table S2.
3.3. Spirometry
Pre and post-bronchodilator spirometry results are seen in Table 1.
Table 1.
Mean, median, and interquartile range of spirometry values pre- and post- bronchodilator of 25 primary cooks in Thanjavur, India.
| Pre-bronchodilator | LPG (n=5) | Biomass (n=20) | ||||||
|---|---|---|---|---|---|---|---|---|
| Mean | Median | IQR | Mean | Median | IQR | p-value | Test | |
| FEVj (%) | 75 | 78 | 20 | 90 | 82 | 36 | 0.40 | unpaired t |
| FVC (%) | 69 | 66 | 17 | 94 | 81 | 54 | 0.27 | unpaired t |
| FEVi/FVC | 91 | 90 | 9 | 87 | 94 | 16 | 0.99 | MW |
| FEF25.75 (%) | 77 | 91 | 33 | 75 | 73 | 47 | 0.90 | unpaired t |
| Post- bronchodilator |
||||||||
| FEVi (%) | 71 | 73 | 38 | 85 | 81 | 27 | 0.38 | MW |
| FVC (%) | 68 | 70 | 20 | 86 | 79 | 33 | 0.25 | unpaired t |
| FEVi/FVC | 92 | 93 | 3 | 86 | 91 | 19 | 0.92 | MW |
| FEF25.75 (%) | 72 | 84 | 43 | 70 | 72 | 42 | 0.85 | unpaired t |
As seen in Table 1, there were no statistically significant differences in lung function (pre-or post- bronchodilator) between participants cooking with LPG or biomass.
Because the ratio of FEV1/FVC after bronchodilator is helpful in determining whether a person is experiencing airway obstruction, we examined the post bronchodilator FEV1/FVC between participants cooking with LPG and biomass, Figure 2.
Figure 2. Post bronchodilator FEV1/FVC by fuel-type.
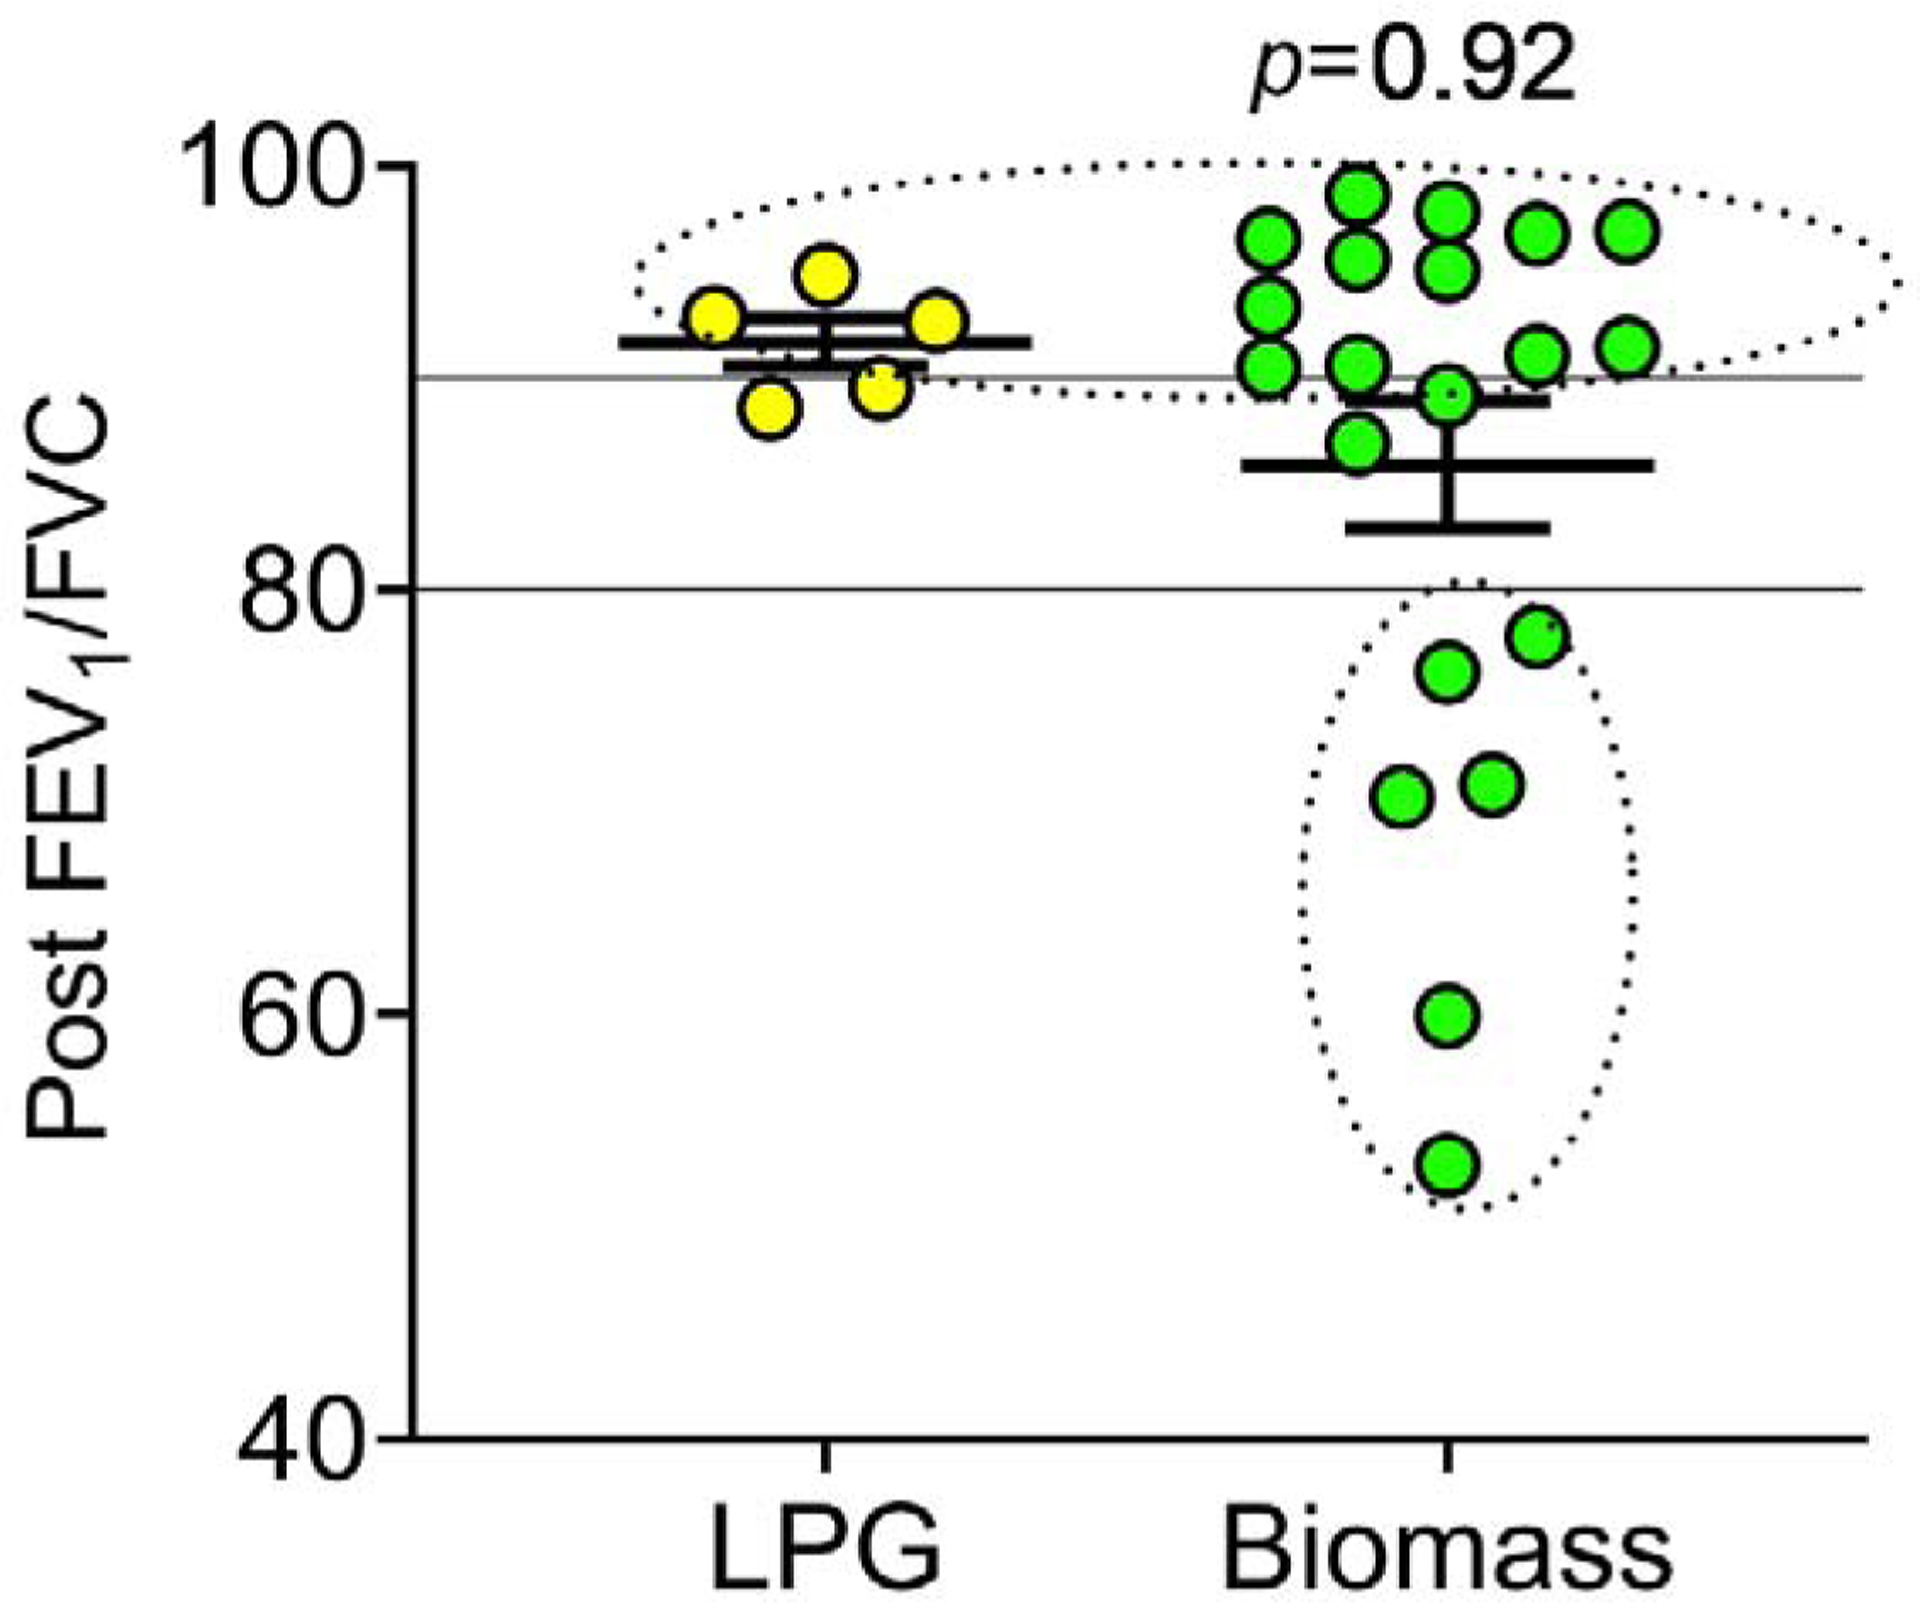
Post FEV1/FVC ratios from each participant, based on fuel-type (LPG n=5, Biomass n=20). FEV1/FVC of 80 and 90 are represented by solid lines, between which lung function is considered normal, and circled values represent the participants with restrictive (>90), and obstructive (<80) lung function. The Mann-Whitney U test was used to determine differences in post bronchodilator FEV1/FVC values between fuel-type.
While there were no statistically significant differences in FEV1/FVC post bronchodilator between groups, six participants in the biomass group had airflow obstruction.Therefore, we assessed the percent of participants from each group with restrictive (FEV1/FVC >90), normal (80–90) or obstructive (<80) lung physiology using post bronchodilator FEV1/FVC ratios.
In the LPG group, 60% (3 of 5) had a post FEV1/FVC in the restrictive category, while the remaining 40% (2 of 5) had normal lung function, and no participants had obstructive lung function. In the biomass group, 60% (12 of 20) had restrictive post FEV1/FVC, 10% (2 of 20) had normal lung function, and 30% (6 of 20) had an obstructive post FEV1/FVC ratio.
3.4. PM2.5
Daily PM2.5 (UPAS) concentrations in primary kitchens ranged from 18–732 μg/m3. We tested whether the DRI (PATS+) recapitulated gravimetric (UPAS) PM2.5 measurements by linear regression of daily paired PM2.5 measurements from kitchens using the PATS+ and UPAS.
As seen in Table 2, fuel-type predicted PM2.5 concentrations, with biomass kitchens having significantly greater concentrations (p≤0.02). Additionally, black carbon (Fabs), 37 mm filter potassium (K) and endotoxin concentrations were significantly greater in biomass kitchens than LPG kitchens. Conversely, filter Iron (Fe) was present in 57% of LPG kitchens’ PM2.5 compared to its presence in one biomass sample.
Table 2.
Geometric mean concentrations, geometric standard deviations and number of samples collected of the follwing endpoints: PM2.5, filter black carbon and potassium, endotoxin (two timepoints), PM bacteria, and mass collected based on fuel-type. P-values determined using the Mann-Whitney U test.
| LPG | Biomass | p-value | |||||
|---|---|---|---|---|---|---|---|
| GM | GSD | n | GM | GSD | n | ||
| UPAS, PM2.5 (ng/m3) | 38 | 2 | 7 | 92 | 2 | 25 | 0.02 |
| PATS+, PM2.5 (pig/m3) | 33 | 2 | 7 | 80 | 2 | 27 | 0.01 |
| Fabs | 1 | 2 | 7 | 4 | 3 | 25 | <0.01 |
| 37 mm filter K (pig/filter) | 5 | 1 | 7 | 13 | 2 | 25 | <0.01 |
| 37 mm filter Fe (pig/filter) | 2 | 1 | 4 | 1 | 1 | 1 | NA |
| 24h Endotoxin (EU/m2) | 229,000 | 4 | 7 | 1,130,000 | 4 | 27 | 0.02 |
| 7-day Endotoxin (EU/m2) | 508,000 | 2 | 7 | 1,850,000 | 2 | 23 | <0.01 |
| Bacteria (CFUs/mL) | 44,400 | 2 | 7 | 31,200 | 3 | 23 | 0.14 |
| Total rug mass (mg) | 532 | 3 | 6 | 1,312 | 3 | 21 | 0.18 |
Zeta-potential was negative in all samples and therefore not log-transformable. Mean (rug-blank corrected) zeta potential from LPG kitchens was −9.2 (SD=4.1, n=5), and −7.5 (SD=3.4, n=17) from biomass kitchens, and not significantly different between fuel-types (unpaired t-test p=0.35). Raw data, arithmetic means, normality results, and statistical tests used can be found in Table S3.
The PATS+ had a strong correlation with UPAS PM2.5 (R2=0.74), based on 32 daily measurements, Figure S1A and peak concentrations occurred during anticipated cooking events, Figure 1D. Additionally, filter PM2.5 <400 μg had a strong correlation (R2=0.71) with Fabs, Figure S1B. Lastly, log-transformed 24 hr endotoxin unit (EU) measurements correlated with log-transformed 7-day EUs, Figure S1C, R2=0.59.
Scanning electron microscopy images of 37 mm PM2.5 filters can be seen in Figure S2A–B.
3.5. Vacuumed PM
To collect particles, we vacuumed rug PM for 60 seconds into a mesh 40 μm sleeve as described in Methods. We collected an average of 1.8 grams (range=0.2–6.2 g, SD=1.7) from 27 homes. There was no significant difference in mass collected between kitchen fuel-types (Mann-Whitney U test, p=0.18), Table 2.
Next, we tested the vacuumed PM samples for known culturable bacteria. Total CFUs/mL from each home can be seen in Figure 3. We also determined speciation of bacteria, Table S4.
Figure 3. Total colony forming units by home.
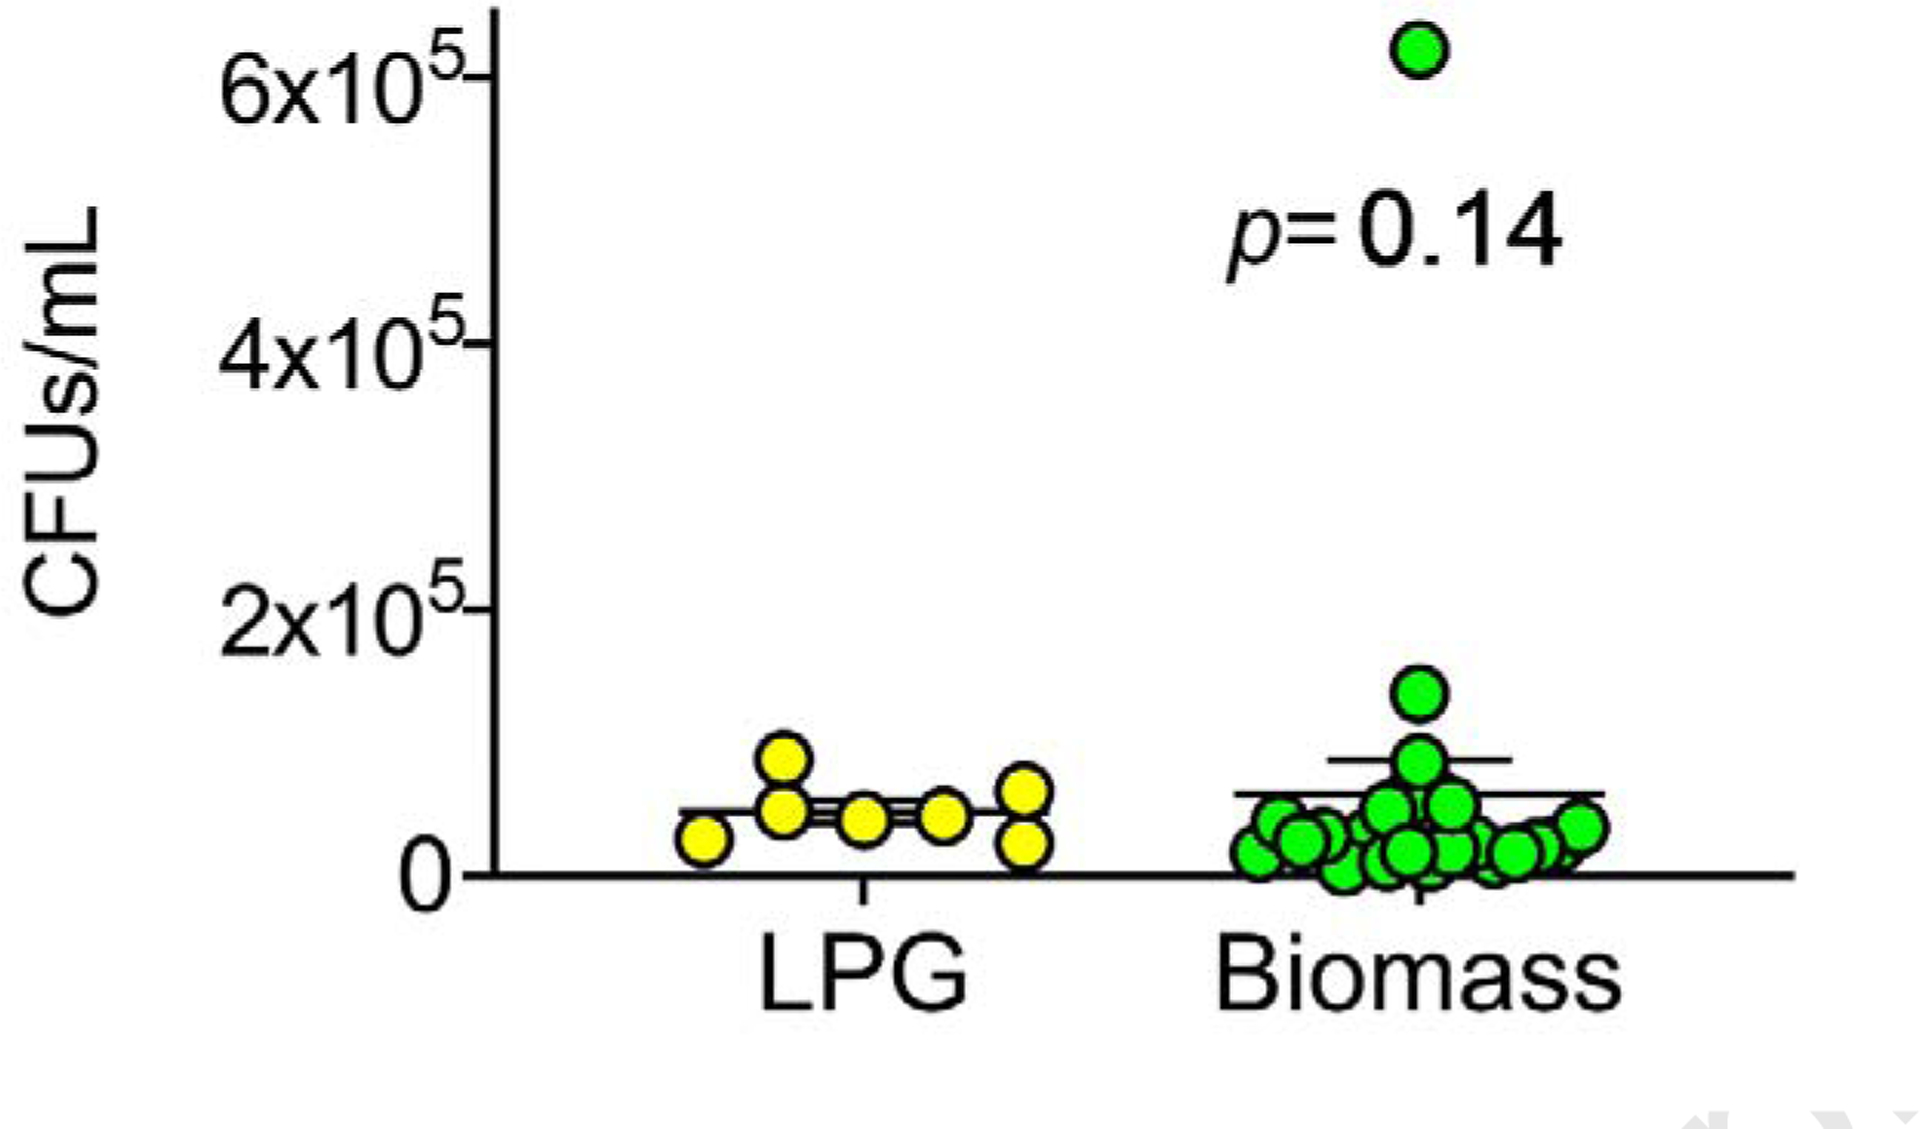
Blank-corrected culturable bacterial CFUs, each dot represents total CFUs/mL per home found in PM (dose=1 mg/mL), by fuel-type.
Because specific metals may be important in determining respiratory health effects, (Bomberger, Coutermarsh, Barnaby, & Stanton, 2012; Mazumdar et al., 2015; Zelikoff, Schermerhorn, Fang, Cohen, & Schlesinger, 2002) we measured the content of PM from LPG and biomass kitchens using XRF, Table 3.
Table 3. Total rug metal content.
Total metal content (GM, ppm), GSD, and number of samples with metal present from biomass and LPG burning kitchens, measured using X ray fluorescence. Metals that are significantly different between fuel-type are in bold text. P-values generated using unpaired t, or Mann-Whitney (MW) U tests, depending on normality of data.
| Element(symbol) | LPG | Biomoss | p-value | Test | ||||
|---|---|---|---|---|---|---|---|---|
| GM (ppm) | GM (ppm) | GSD | GM (ppm) | GM (ppm) | GSD | |||
| As | 6 | 1 | 7 | 10 | 2 | 22 | 0.03 | MW |
| Cu | 37 | 1 | 4 | 140 | 1 | 1 | <0.01 | unpaired t |
| Fe | 6,000 | 2 | 7 | 14,200 | 2 | 23 | <0.01 | MW |
| S | 939 | 2 | 5 | 489 | 2 | 23 | 0.02 | MW |
| V | 21 | 3 | 7 | 62 | 2 | 23 | <0.01 | unpaired t |
| Zr | 125 | 2 | 7 | 307 | 2 | 23 | 0.02 | unpaired t |
| BAI | 175,500 | 1 | 7 | 191,900 | 1 | 23 | 0.34 | unpaired t |
| Bi | 9 | 1 | 5 | 12 | 2 | 20 | 0.34 | MW |
| Co | 51 | 1 | 4 | 77 | 2 | 22 | 0.07 | MW |
| Cr | 20 | 3 | 6 | 8 | 4 | 7 | 0.13 | MW |
| K | 11,100 | 2 | 7 | 12,800 | 2 | 23 | 0.40 | unpaired t |
| Mn | 134 | 1 | 2 | 89 | 4 | 14 | >0.99 | MW |
| Nb | 2 | 1 | 1 | 2 | 2 | 9 | NA | NA |
| Pb | 26 | 2 | 7 | 17 | 3 | 23 | 0.35 | MW |
| Rb | 24 | 1 | 7 | 25 | 2 | 23 | 0.53 | unpaired t |
| Sc | 101 | 2 | 5 | 62 | 4 | 8 | 0.91 | unpaired t |
| Sr | 146 | 1 | 7 | 164 | 2 | 23 | 0.31 | unpaired t |
| Th | 6 | 1 | 7 | 10 | 2 | 23 | 0.10 | MW |
| Ti | 1,400 | 2 | 7 | 2,050 | 1 | 23 | 0.11 | MW |
| U | 6 | 1 | 7 | 6 | 1 | 13 | 0.57 | MW |
As seen in Table 3, biomass burning kitchen PM had significantly higher Zr, As, Cu (n=1), Fe and V content, while LPG kitchens had higher S (Mann-Whitney U test p=0.02). Raw data including arithmetic means, normality results, and statistical tests used can be found in Table S5.
In our analysis, we did not find a single environmental parameter to correlate with lung function.
3.6. In vitro assays
3.6.1. Cytotoxicity of PM on human airway epithelial A549 cells
PM has been reported to disrupt the airway epithelial barrier (Caraballo, Borcherding, Thorne, & Comellas, 2013). In addition, PM impairs mechanisms of airway innate immunity (Buonfiglio et al., 2017). Therefore, we explored whether PM collected from individual kitchens would recapitulate these findings.
To test whether PM from LPG or biomass was toxic to small airway epithelia, we applied seven doses of PM from both fuel groups and measured LDH release, Figure 4.
Figure 4. Cytotoxicity of a human airway epithelial cell-line exposed to LPG or Biomass kitchen PM.
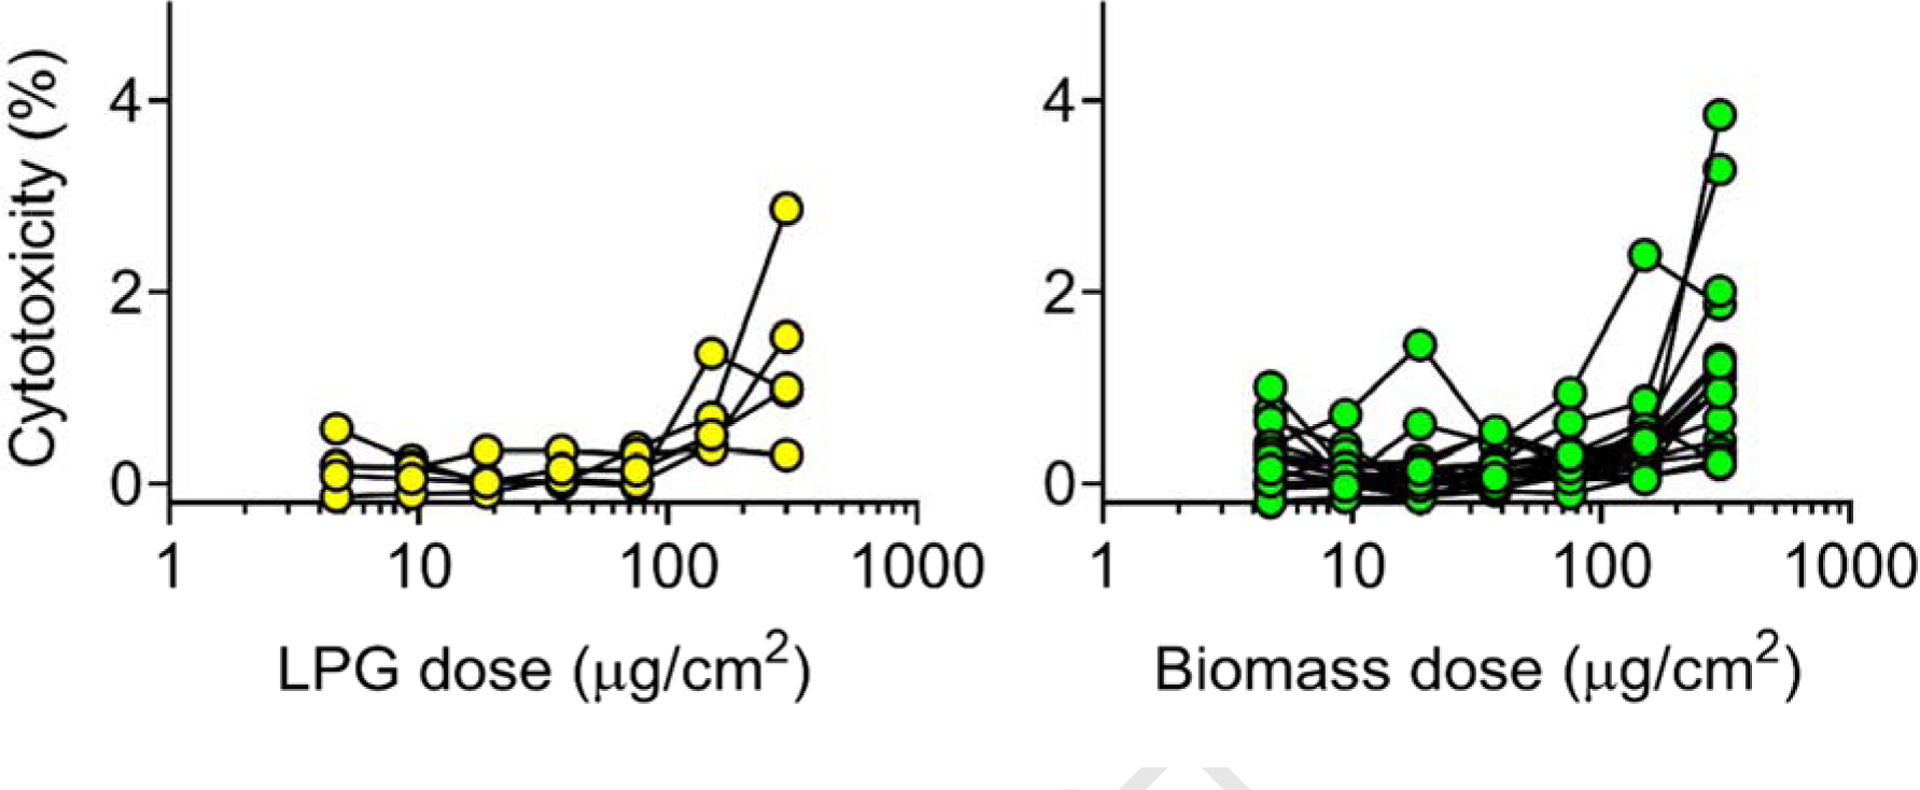
Seven doses (4.7, 9.4, 18.8, 37.5, 75, 150, 300 μg/cm2) of PM from homes where spirometry and PM (n=22) was obtained were applied to A549 cells overnight, and percent cytotoxicity measured the following day.
Cytotoxicity by PM dose and fuel-type can be seen in Figure 4; no difference was found in LDH release between fuel-types (dose 300 μg/cm2, Mann-Whitney U test, p=0.65), and percent cytotoxicity was consistently <4%. Percent cytotoxicity was greater in cells exposed to biomass and LPG PM than in cells exposed to volcanic ash (LPG and biomass arithmetic mean range= −0.14–3.8, volcanic ash range= −0.14–0.11).
3.6.2. Transepithelial conductance of passaged HAE cells at an air-liquid interface
We assessed the change in transepithelial conductance of PM treated cells over 24 hours. There was no difference in conductance between fuel-types (Mann-Whitney U test p=0.16).
Because there were both restrictive and obstructive phenotypes in our cohort, we next assessed whether PM from homes of participants with restrictive and obstructive phenotypes altered epithelial conductance compared to cells treated with PM from homes of people with normal spirometry, Figure 5.
Figure 5. Conductance of human airway epithelial cells at air-liquid interface after exposure to PM from participants’ homes based on spirometry phenotype.
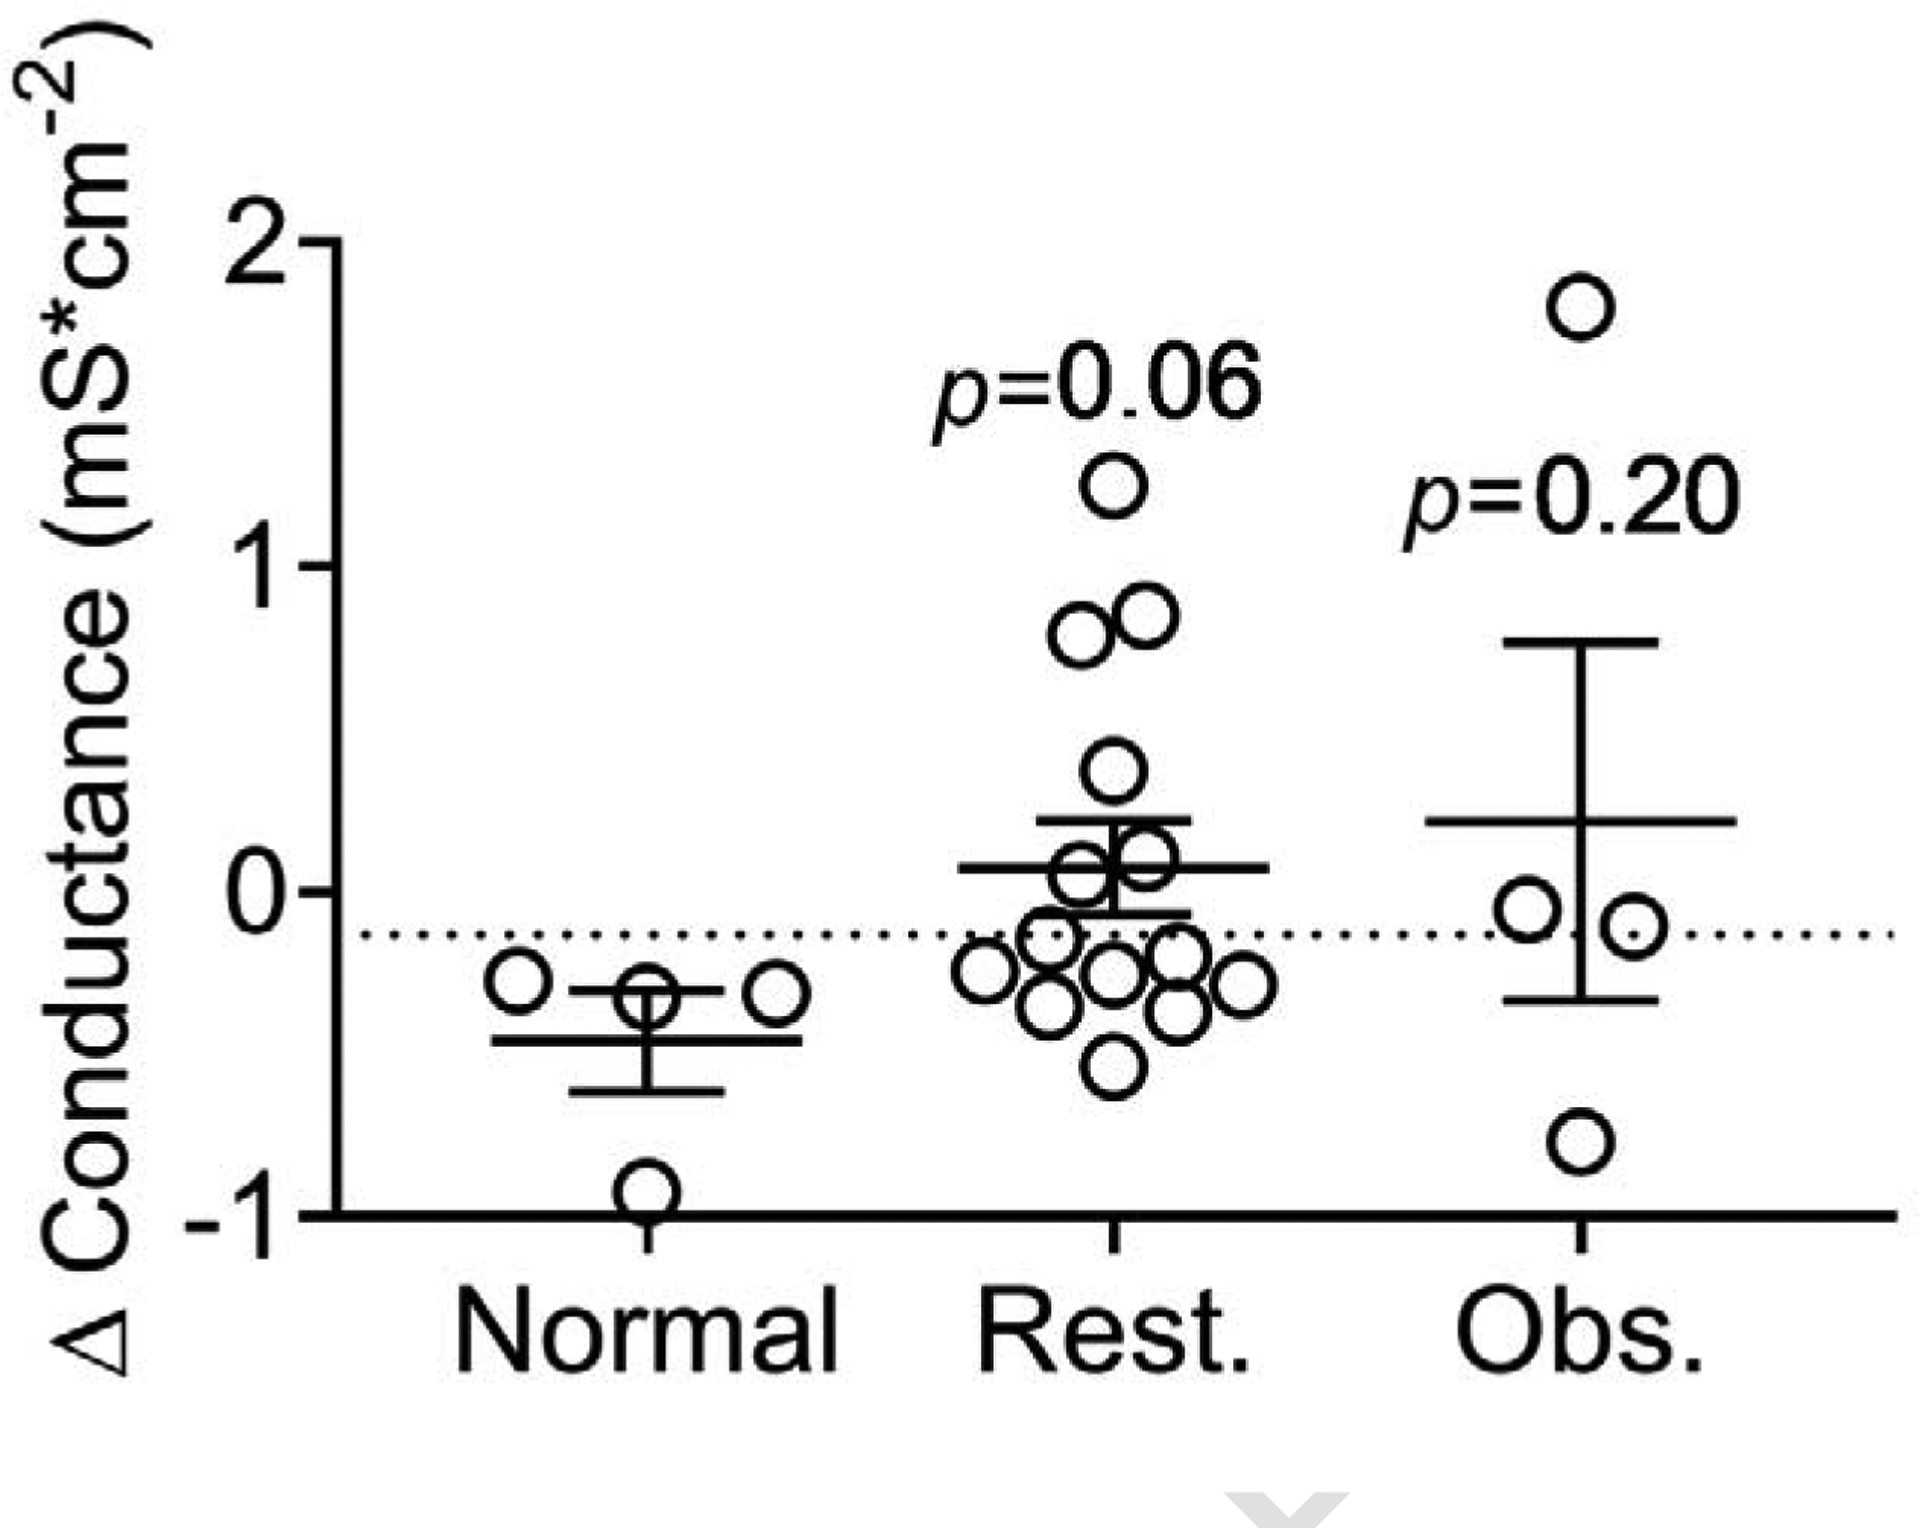
Change in 24-hr conductance (mS*cm2) after the NuLi HAE cell-line at ALI were exposed to PM from 22 homes. “Normal” indicates cells treated with PM from homes of participants with normal spirometry (post bronchodilator FEV1/FVC = 80–90), “Rest.” indicates cells treated with PM from homes of participants with restrictive spirometry (post FEV1/FVC >90) and “Obs.” indicates cells treated with homes of those with obstructive spirometry (post FEV1/FVC <80). Results from cells treated with PM from homes of participants with normal spirometry were compared to results from cells treated with PM from obstructive and restrictive homes using Mann-Whitney U tests, and the dotted line indicates conductance of control (vehicle treated) cells.
As seen in Figure 5, there was a trend of increased conductance in cells treated with PM from homes of participants with a restrictive phenotype (p=0.06). PM from participants’ homes with an obstructive physiology did not significantly alter conductance compared to PM from homes of participants with normal spirometry (p=0.20). When PM from homes of participants with either restrictive or obstructive phenotype are compared to those with normal spirometry, increased conductance was observed (p≤0.05), pooled data not shown.
3.6.3. Permeability of low-molecular-weight FITC-conjugated dextran in HAE cells at ALI
Next, we tested FITC-D from basolateral media of HAE cells at the ALI exposed to PM from both fuel-types (n=22) as a function of barrier integrity (Hulbert et al., 1989). We found no difference in FITC-D between fuel-types (Mann-Whitney U test, p=0.95).
However, we found a negative correlation between participants’ post-FEV1/FVC and basolateral FITC-D concentrations (R2= −0.57). Therefore, we assessed FITC-D permeability based on participants’ spirometry phenotype, Figure 6.
Figure 6. FITC dextran permeability of human airway epithelial cells at air-liquid interface after exposure to PM from participants’ homes based on spirometry phenotype.
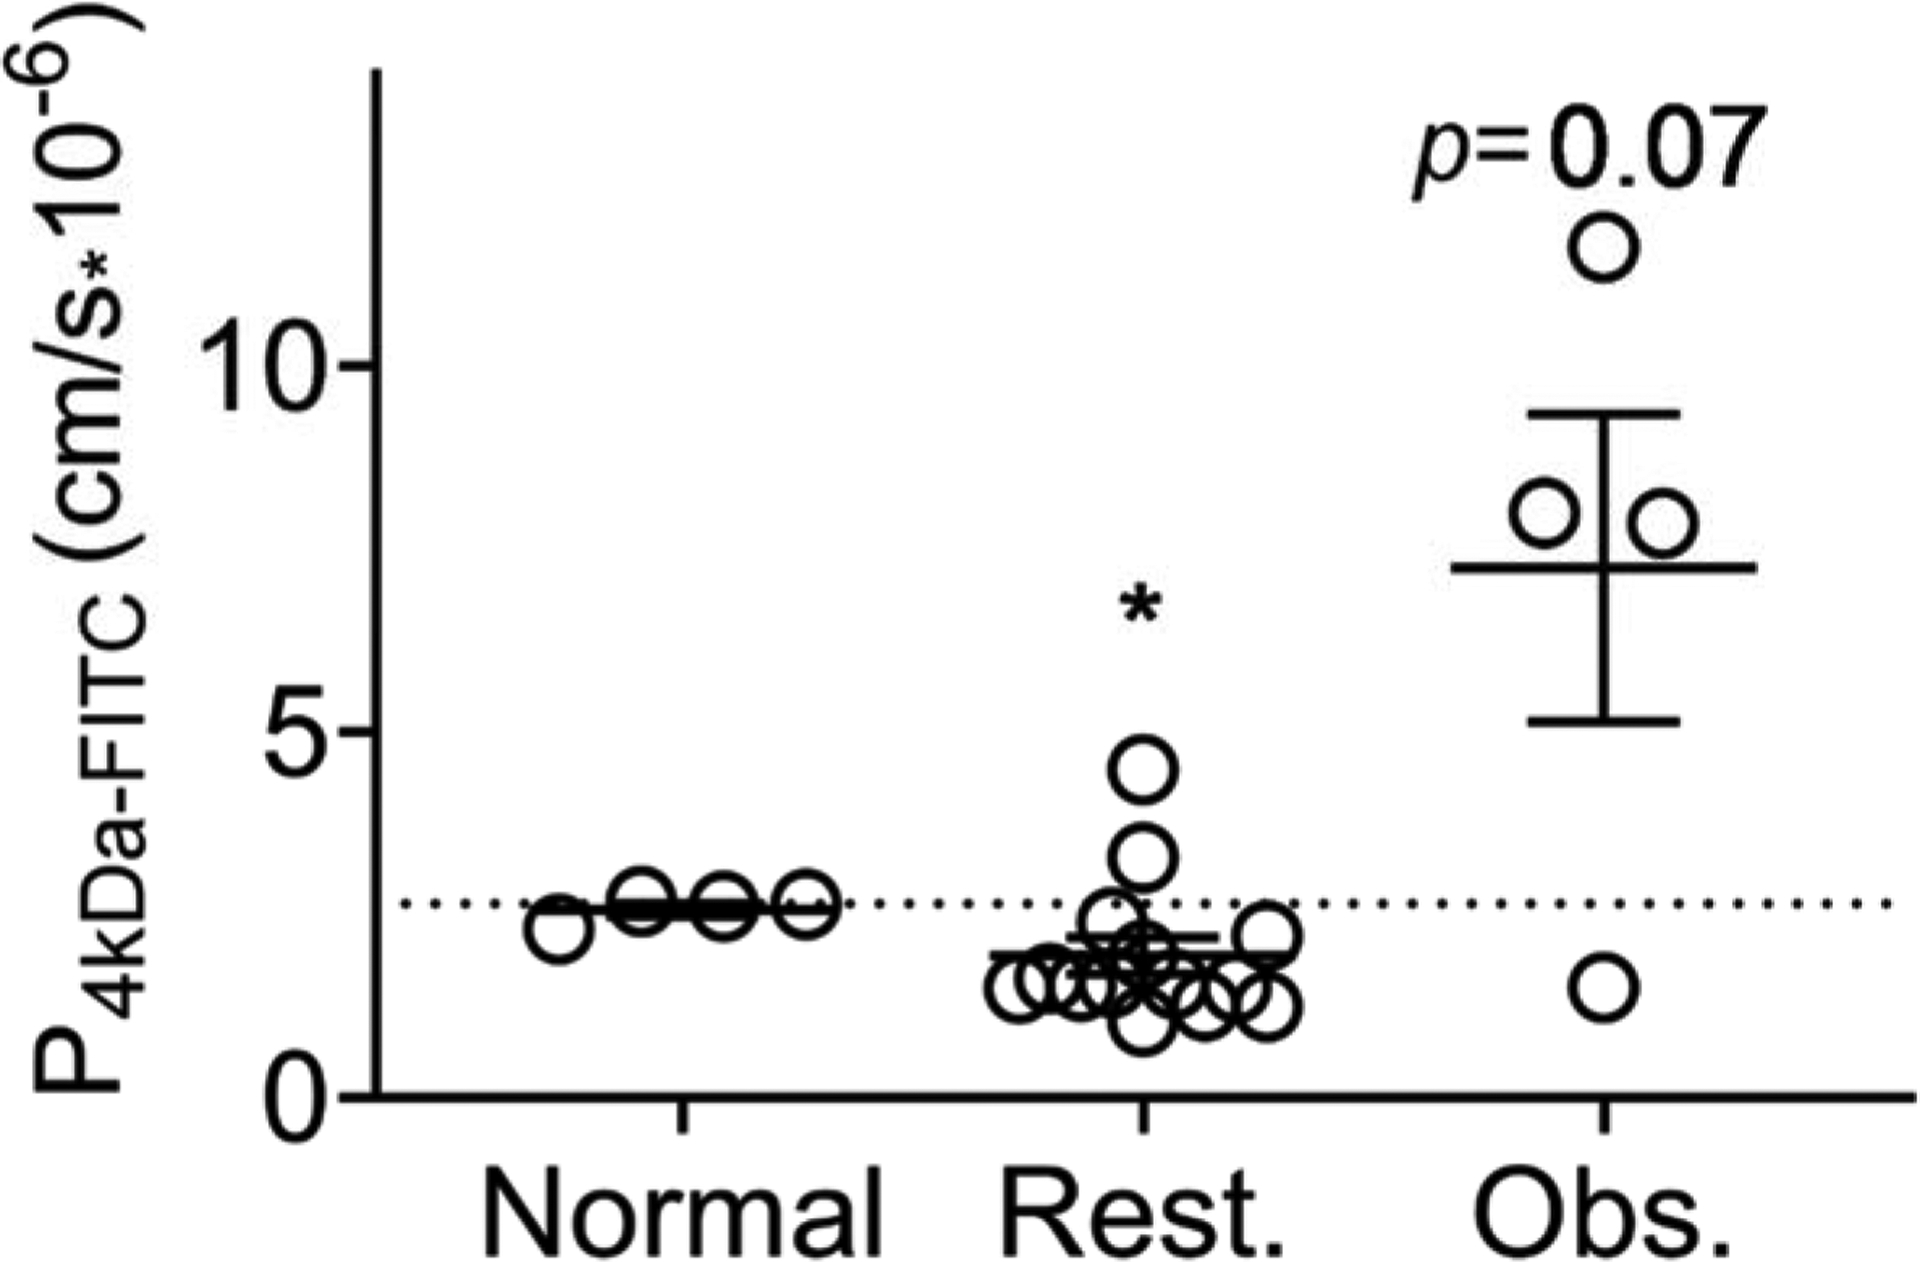
Permeability of FITC-D after 24 hours, collected from basolateral media of NuLi HAE cell-line at ALI after exposure to 30 μg/cm2 PM, grouped by participants’ spirometry results. “Normal” indicates cells treated with PM from homes of participants with normal spirometry (post bronchodilator FEV1/FVC = 80–90), “Rest.” indicates cells treated with PM from homes of participants with restrictive spirometry (post FEV1/FVC >90) and “Obs.” indicates cells treated with homes of those with obstructive spirometry (post FEV1/FVC <80). The dotted line indicates control permeability. Cells treated with PM from “normal” spirometry results were compared to PM from restrictive homes using a Mann-Whitney U test and compared to PM from obstructive homes using an unpaired t-test.
PM from participants with “normal” (FEV1/FVC 80–90, n=4) spirometry resulted in equivalent FITC-D permeability as control cells (no PM, dotted line). PM from participants with a restrictive phenotype (FEV1/FVC >90, n=14) resulted in significantly lower FITC-D permeability (Mann-Whitney U test, p≤0.05), Figure 6. There was a trend of increased FITC-D permeability when HAE cells at ALI were exposed to PM from homes of participants with obstruction (FEV1/FVC <80, n=4, unpaired t-test, p=0.07). PM from three out of the four homes of participants with respiratory obstruction increased FITC-D permeability. FITC-D permeability and transepithelial conductance were not correlated (R2<0.01).
3.6.4. Antimicrobial activity of primary HAE cells
We tested the effect of PM on antimicrobial activity of primary HAE cells (from organ donors at the cell-culture core, University of Iowa). We treated ASL with PM from 19 homes, then exposed the mixture to a bacterial challenge of S. aureus and assessed the percent of live bacteria remaining after 10 minutes, Figure 7.
Figure 7. Antimicrobial activity of airway surface liquid with and without exposure to PM from cooks’ homes.
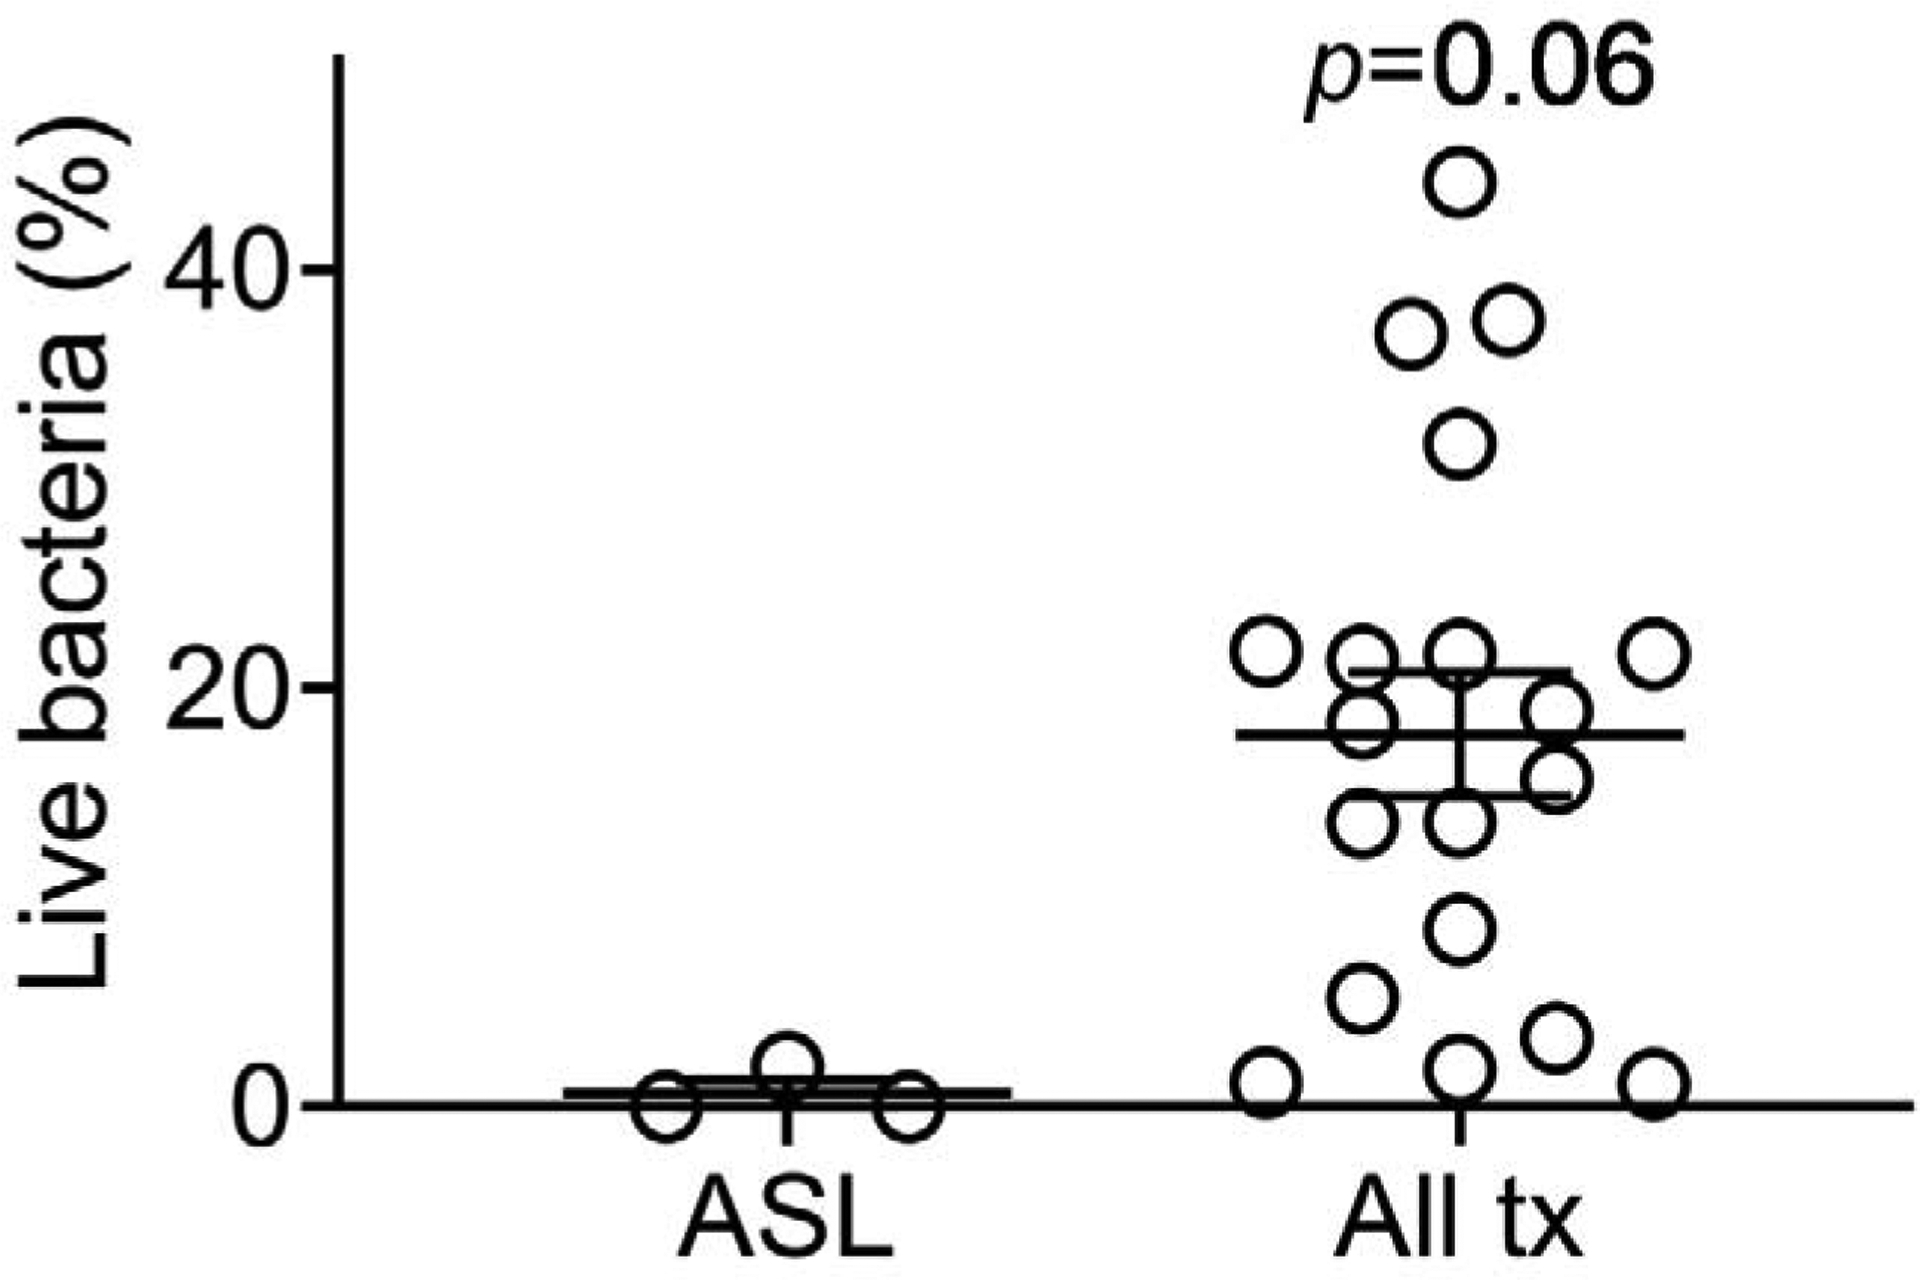
Percent of live S. aureus exposed to three human donor’s ASL + vehicle after 10 minutes compared to the percent of live bacteria after ASL is exposed to PM from cooks’ homes (each dot represents summary data from 3 donor ASL for each of 19 homes), Mann-Whitney U test comparing ASL alone (n=3) to all PM-treated ASL (n=19), p=0.06.
PM from all homes tended to inhibit antimicrobial activity of primary HAE ASL within 10 minutes (p=0.06). There was no difference in effect based on fuel-type (Kruskal-Wallis test with multiple comparisons test ASL vs. LPG p=0.15, ASL vs. Biomass p=0.21, between fuels p>0.99). Results from individual homes are presented in Table S6.
4. DISCUSSION
We measured lung function in primary cooks and identified a sub-group within cooks using biomass who had respiratory obstruction (30%), which agrees with a similar value previously observed in an Indian biomass-cooking population (Mukherjee et al., 2014). We expected to find some respiratory alterations in all study participants, due to typically high ambient PM2.5 concentrations in Thanjavur (30–52 μg/m3 during study period), especially given participants’ residential proximity (KBerkeley Earth, 2020). However, biomass homes had increased PM2.5 and respiratory obstruction, a finding not observed in our small LPG cohort. We were unable to control for ambient exposures but would expect ~2 LPG participants to have obstructive spirometry if ambient exposures were the attributable cause of obstruction (applying the same rate of obstruction observed in the biomass population). Moreover, in a thorough metanalysis regarding respiratory effects of biomass cooking, Hu et al. found an increased risk (OR=2.44) of developing COPD after exposure to biomass smoke, and a separate analysis found that wood burning resulted in the highest risk of COPD (OR=4.29) compared to other fuel-types (Kurmi et al., 2010). Consistent with our findings, biomass-exposed populations have previously been described as having either obstructive and/or restrictive lung disease (Kargin et al., 2011; Özbay, Uzun, Arslan, & Zehir, 2001). In our study, only 10% of the biomass group had normal lung function, while 60% had a restrictive physiology (FEV1/FVC >90), the same percentage of those with restriction in the LPG group (60%). Interestingly, while none of the LPG cooks had respiratory obstruction, all had previously been exposed to biomass and switched to LPG 10–15 years ago (while biomass users continued using the same fuel-type), indicating the potential respiratory benefits of switching from wood to cleaner fuel. Ongoing computed tomography (CT) imaging analysis from this study population likely will provide a better understanding of the heterogeneity of chronic lung disease in this population.
PM2.5 was greater in biomass kitchens than LPG kitchens (p=0.02). Gravimetric arithmetic mean 24-hour PM2.5 was 120 μg/m3 (SD=162), which is slightly higher but similar to previously reported LPG and biomass fuel 24-hour PM2.5 in rural Tamil Nadu (mean=105 ± 114 μg/m3) (Balakrishnan et al., 2018) and greater than the World Health Organization guideline of 25 μg/m3 (WHO, 2006). In biomass homes, PM2.5 concentrations were greater. We confirmed that DRIs robustly estimated gravimetrically measured PM2.5 (R2=0.74) in biomass and LPG kitchens, allowing for quantification of peak exposures in highly polluted environments, and providing an alternative to gravimetric monitors. We demonstrated that an inexpensive method to estimate black carbon (by quantifying filter light absorption) correlated with PM2.5 field measurements (R2=0.71), facilitating the addition of black carbon into health effects estimates. While filter loading can interfere with accuracy of Fabs measurement, we addressed this by only including PM2.5 filter mass <400 μg. Lastly, we obtained particles using a collection method (DUSTREAM®) typically used in other settings (e.g. allergen testing), which allowed us to measure biologically and chemically relevant content. Significant environmental differences were found in biomass and LPG kitchens: biomass kitchens had greater PM2.5, Fabs, iron, arsenic, copper, zirconium and endotoxin concentrations, and LPG kitchens had higher sulphur concentrations. Not only are there strong associations with specific content in the particles and health effects, (Bomberger et al., 2012; Schwartz et al., 1994; Zanobetti et al., 2009) but access to the physical particles enabled us to assess biological effects in vitro.
Respiratory health effects of metals have been previously investigated. Three metals associated with chronic and acute lung disease were identified as being elevated in biomass homes compared to LPG. Arsenic (As) has robust respiratory health effects, (Bomberger et al., 2012; Enterline, Henderson, & Marsh, 1987; Mazumdar et al., 2015; Mazumder et al., 2000) as does Iron, (Buonfiglio et al., 2018; Ghio et al., 2008; Strak et al., 2012) and Vanadium (Dreher et al., 1997; Silbajoris et al., 2000). Zirconium (Zr) was also greater in biomass homes compared to LPG, although we did not find literature regarding health effects of Zr on airway epithelia. LPG homes had higher Sulphur concentrations than biomass burning homes. Sulphur dioxide can reduce airway cell ciliary beat frequency, required for mucociliary clearance (Norris & Jackson, 1989; Tamaoki, Chiyotani, Sakai, Takeyama, & Konno, 1993).
We demonstrated that the use of an EDC, a passive and inexpensive method of sampling bioaerosols, for 24 hours can estimate within-kitchen endotoxin concentrations over a 7-day period (R2=0.59). The median endotoxin concentration measured in kitchens was >1000 times greater than the median concentration found in other studies including in Copenhagen (Madsen et al., 2012), Iowa (Kilburg-Basnyat et al., 2016), and elsewhere (Kilburg-Basnyat, Metwali, & Thorne, 2016; Noss et al., 2010). Typically, EDCs are deployed for two-weeks (Kilburg-Basnyat et al., 2016). However, in our study a 24-hour period was enough to predict 7-day concentrations. We did not find an association with EUs and reported animal entry to house, but based on personal observations, our survey potentially underestimated this variable. Endotoxin has been associated with asthma and wheeze (Thorne et al., 2005; Thorne et al., 2015), COPD (Mendy et al., 2018), and byssinosis, a chronic respiratory syndrome leading to long-term disability if exposure continues (Bouhuys, Beck, & Schoenberg, 1979; Castellan et al., 1987; Imbus & Suh, 1973; Tockman & Baser, 1984).
Several factors can influence the development of chronic lung disease. One of them is recurrent respiratory infections. An initial and key mechanism to protect the lungs from respiratory infections is ASL bactericidal activity. We have previously reported that indoor PM from the U.S. can impair ASL bactericidal activity (Stapleton et al., 2019). We set out to examine the effects of indoor PM collected in India on ASL bactericidal activity. Although PM from all homes had a trend (p=0.06) of impairing ASL bactericidal activity (likely due to the small sample size), we saw no difference in the effect based on fuel-source. Negatively charged particles have been shown to adsorb to cationic antimicrobial peptides and proteins (AMPs), allowing for fewer available AMPs upon bacterial challenge (Buonfiglio et al., 2017). We saw no difference in zeta-potential of PM between fuel-types, therefore particles from all homes likely acted similarly on ASL bactericidal activity.
Another mechanism that can influence the development of chronic lung diseases is disruption of the lung epithelial barrier integrity (Jones et al., 1980). Disruption of this barrier has been shown to result in different lung diseases including acute lung injury, obstructive and restrictive lung diseases (LeSimple, Liao, Robert, Gruenert, & Hanrahan, 2010). In our study we show that exposing HAE cells to PM disrupted barrier integrity and the results were associated with lung phenotypes. 75% of the PM from homes of participants with respiratory obstruction increased FITC-D permeability, and there was a trend of increased permeability in cells treated with PM from obstructive homes compared to cells treated with PM collected from participants with normal lung function (p=0.07). Interestingly, PM from homes of participants with respiratory restriction significantly decreased FITC-D permeability (p≤0.05), but also tended to increase electrical conductance (p=0.06). This divergence between macromolecular and electrical permeability has been observed in other preparations (Van Itallie & Anderson, 2004) and suggests that PM composition can affect these distinct junctional properties. Within our analysis, we did not find elemental differences in PM from homes of participants with distinct phenotypes. Therefore, the mechanism responsible for these permeability changes in our experiments is unknown and requires further examination (Caraballo et al., 2013; Serikov, Choi, Chmiel, Wu, & Widdicombe, 2004).
For in vitro assays, we used primary HAE cells to analyze bactericidal activity, as it has been demonstrated that primary cells contain similar AMPs to those found in vivo (Ali, Lillehoj, Park, Kyo, & Kim, 2011; Candiano et al., 2007; Kesimer et al., 2009), and ASL from primary HAE cells can be continuously collected over time. However, primary cells are a valuable resource not suitable for large throughput assays, and present donor variability issues due to genetic heterogeneity, making them not ideal for comparing PM from multiple homes; therefore, we used immortalized airway cells (NuLi cell-line) that are polarized and have similar electrical properties to native airway (Zabner et al., 2003) for both the electrical and macro-molar permeability assays. We hypothesized spirometry results may be due to alveolar cell death, indicative of emphysema, and to test this hypothesis, we used an alveolar cell-line (A549) to assess cytotoxicity, while eliminating donor variability. We feel that the airway cells selected for our assays represent accurate models to test the respective hypotheses.
Study strengths include the granularity of our particle characterization in homes using wood biomass and LPG in Tamil Nadu, India. In the PM, we found biologically active agents known to influence airway immunity and respiratory tract infection, the effect of which will be further analyzed in our analysis including CT parameters. We demonstrated that cooks using biomass fuel had more respiratory obstruction than those using LPG. Methods used to characterize the kitchen microenvironment are readily accessible, cost-effective, and well correlated to more standard methods. We were able to demonstrate specific mechanisms (e.g. compromised epithelial barrier integrity and increased electrical conductance) potentially responsible for airway disease resulting from PM exposures. Lastly, our sampling from LPG and biomass homes occurred in the same neighborhoods, indicating well-controlled ambient exposures. This signifies that our high incidence of respiratory restriction (60%) in both groups is perhaps driven by ambient exposures, while obstruction appears to be unique to biomass exposures.
There are limitations in drawing conclusions related to participants’ lung function and their indoor PM and endotoxin exposures. Study limitations include the small sample size and limited geographical range and confounding exposures (71% of biomass participants work outside of the home). We did not sample occupational environments, a likely confounder, since LPG cooks were: less likely to work outside of the home, of a higher socioeconomic status, and had fewer exposures. Our environmental assessment was for a short time period, which is difficult to extrapolate to the lifetime of study participants. We did not sample ambient concentrations over the entire study period, although when we did, they were consistent with the Indian government’s reported measurements. PM used for the in vitro assays was collected from rugs, which may not approximate all respirable particles, however, particle re-suspension and settling occurs throughout the day and we felt a 7-day period would allow for collection of particles representing distinct exposures. Due to the nature of our study (a pilot), the DUSTREAM® collector was the best tool available to collect whole particles, facilitating later use in our laboratory. Additionally, our PM2.5 and endotoxin collections occurred at breathing height. Finally, our PM collection method likely included dried dirt, however, ambient dirt existed inside all homes, indicating respiratory (while cooking at low height) and dermal exposures. Despite these limitations, PM collected from homes of participants with abnormal spirometry significantly altered barrier integrity and ion transport of HAE cells in vitro, indicating its utility as a surrogate of primary cooks’ exposures. Additionally, the intra-fuel type heterogeneity and similarity in findings to other studies (Balakrishnan et al., 2018) speaks to the universality of our findings for this fuel-type and geographical region.
5. CONCLUSIONS
Our results confirmed that 30% of biomass cooks have an obstructive physiology and validated distinct efficacious, inexpensive, and novel means of collecting and monitoring indoor pollutants in rural India. We demonstrated potential mechanisms to explain cooks’ abnormal physiology. Lastly, our study provides granular data of indoor PM and endotoxin levels, with a detailed examination of the particles’ chemical characteristics, including metals and zeta potential, and provides further insights into possible mechanisms associated with lung injury and respiratory infections.
Supplementary Material
Highlights.
PM from two cookstove fuel types had distinct combustion and bioaerosol properties
30% of women cooking with wood had respiratory obstruction, none using LPG did
Respiratory restriction was common in both groups (60%)
PM from homes of subjects with obstruction or restriction altered cell permeability
PM from all homes tended to inhibit innate immunity
ACKNOWLEDGEMENTS
The authors would like to acknowledge Dr. S. Narendran, Royal Hospitals, Thanjavur, for his ethical committee assistance and Dr. Suresh, Suresh Scans, Thanjavur. Vijay Pradeep and Mangesh provided valuable field-work and translational assistance. The authors would like to thank Dr. K Mujibur Rahman, the head National Pharma Hospital, Thanjavur, for being instrumental in encouraging the success of the project, arranging logistics, and support. Jennifer Bliss provided invaluable energy and assistance in fieldwork and the home visits. We are very grateful to Dr. Michael Brauer for his help and expertise in black carbon analysis. We thank the PMIST students for their assistance in survey translation for study participants and PMIST faculty for their encouragement and participation. Lastly, we are very grateful to the study participants for their generosity, kindness, and willingness to participate in our study.
This work was supported by the University of Iowa Environmental and Health Science Research Center (EHSRC, National Institute of Environmental Health Sciences, NIH 5P30 ES005605), by the Bowers Emphysema Research Fund, the Origins of Cystic Fibrosis Airway Disease NIH PPG HL091842-11, and additional NIH funding (NIH R01HL112986, NIH R01HL126838 and NIH R01HL130883).
Footnotes
Publisher's Disclaimer: This is a PDF file of an unedited manuscript that has been accepted for publication. As a service to our customers we are providing this early version of the manuscript. The manuscript will undergo copyediting, typesetting, and review of the resulting proof before it is published in its final form. Please note that during the production process errors may be discovered which could affect the content, and all legal disclaimers that apply to the journal pertain.
CONFLICT OF INTEREST
The authors declare no competing financial interests related to the work described.
HUMAN SUBJECTS
The work described in this article has been carried out in accordance with The Code of Ethics of the World Medical Association (Declaration of Helsinki) for experiments involving humans, the EC Directive 86/609/EEC for animal experiments, and the Uniform Requirements for manuscripts submitted to Biomedical journals. This study was approved by the Institutional Review Board (IRB) at the University of Iowa, the IRB at PMIST, and by the Indian government.
REFERENCES
- Ali M; Lillehoj EP; Park Y; Kyo Y; Kim KC Analysis of the proteome of human airway epithelial secretions. Proteome science 2011;9:4. [DOI] [PMC free article] [PubMed] [Google Scholar]
- Assad NA; Kapoor V; Sood A Biomass smoke exposure and chronic lung disease. Current opinion in pulmonary medicine 2016;22:150–157 [DOI] [PubMed] [Google Scholar]
- Balakrishnan K; Ghosh S; Thangavel G; Sambandam S; Mukhopadhyay K; Puttaswamy N; Sadasivam A; Ramaswamy P; Johnson P; Kuppuswamy R Exposures to fine particulate matter (PM2. 5) and birthweight in a rural-urban, mother-child cohort in Tamil Nadu, India. Environmental research 2018;161:524–531 [DOI] [PubMed] [Google Scholar]
- Bomberger JM; Coutermarsh BA; Barnaby RL; Stanton BA Arsenic promotes ubiquitinylation and lysosomal degradation of cystic fibrosis transmembrane conductance regulator (CFTR) chloride channels in human airway epithelial cells. Journal of Biological Chemistry 2012;287:17130–17139 [DOI] [PMC free article] [PubMed] [Google Scholar]
- Bouhuys A; Beck G; Schoenberg JB Priorities in prevention of chronic lung diseases. Lung 1979;156:129–148 [DOI] [PubMed] [Google Scholar]
- Buonfiglio LGV; Borcherding JA; Frommelt M; Parker GJ; Duchman B; Calderón OGV; Fernandez-Ruiz R; Noriega JE; Stone EA; Gerke AK Airway surface liquid from smokers promotes bacterial growth and biofilm formation via iron-lactoferrin imbalance. Respiratory Research 2018;19:42. [DOI] [PMC free article] [PubMed] [Google Scholar]
- Buonfiglio LGV; Mudunkotuwa IA; Alaiwa MHA; Calderón OGV; Borcherding JA; Gerke AK; Zabner J; Grassian VH; Comellas AP Effects of Coal Fly Ash Particulate Matter on the Antimicrobial Activity of Airway Surface Liquid. Environmental Health Perspectives 2017;125 [DOI] [PMC free article] [PubMed] [Google Scholar]
- Candiano G; Bruschi M; Pedemonte N; Musante L; Ravazzolo R; Liberatori S; Bini L; Galietta LJ; Zegarra-Moran O Proteomic analysis of the airway surface liquid: modulation by proinflammatory cytokines. American Journal of Physiology-Lung Cellular and Molecular Physiology 2007;292:L185–L198 [DOI] [PubMed] [Google Scholar]
- Caraballo JC; Borcherding J; Thorne PS; Comellas AP Protein Kinase C–ζ Mediates Lung Injury Induced by Diesel Exhaust Particles. American journal of respiratory cell and molecular biology 2013;48:306–313 [DOI] [PMC free article] [PubMed] [Google Scholar]
- Castellan RM; Olenchock SA; Kinsley KB; Hankinson JL Inhaled endotoxin and decreased spirometric values. New England Journal of Medicine 1987;317:605–610 [DOI] [PubMed] [Google Scholar]
- Chan KH; Kurmi OP; Bennett DA; Yang L; Chen Y; Tan Y; Pei P; Zhong X; Chen J; Zhang J Solid fuel use and risks of respiratory diseases. A cohort study of 280,000 Chinese never-smokers. American journal of respiratory and critical care medicine 2019;199:352–361 [DOI] [PMC free article] [PubMed] [Google Scholar]
- Dills RL; Zhu X; Kalman DA Measurement of urinary methoxyphenols and their use for biological monitoring of wood smoke exposure. Environmental research 2001;85:145–158 [DOI] [PubMed] [Google Scholar]
- Dreher KL; Jaskot RH; Lehmann JR; Richards JH; Ghio JKMAJ; Costa DL Soluble transition metals mediate residual oil fly ash induced acute lung injury. Journal of toxicology and environmental health part a 1997;50:285–305 [PubMed] [Google Scholar]
- Enterline PE; Henderson VL; Marsh GM Exposure to arsenic and respiratory cancer a reanalysis. American Journal of Epidemiology 1987;125:929–938 [DOI] [PubMed] [Google Scholar]
- Forbes B; Ehrhardt C Human respiratory epithelial cell culture for drug delivery applications. European journal of pharmaceutics and biopharmaceutics 2005;60:193–205 [DOI] [PubMed] [Google Scholar]
- Fulambarker A; Copur AS; Javeri A; Jere S; Cohen ME Reference values for pulmonary function in Asian Indians living in the United States. Chest 2004;126:1225–1233 [DOI] [PubMed] [Google Scholar]
- Ghio AJ; Hilborn ED; Stonehuerner JG; Dailey LA; Carter JD; Richards JH; Crissman KM; Foronjy RF; Uyeminami DL; Pinkerton KE Particulate matter in cigarette smoke alters iron homeostasis to produce a biological effect. American journal of respiratory and critical care medicine 2008;178:1130–1138 [DOI] [PubMed] [Google Scholar]
- Gordon SB; Bruce NG; Grigg J; Hibberd PL; Kurmi OP; Lam K.-b.H.; Mortimer K; Asante KP; K Balakrishnan; Balmes J; Bar-Zeev N; Bates MM; Breysse PN; Buist S; Chen Z; Havens D; Jack D; Jindal S; Kan H; Mehtra S; Moschovis P; Naeher L; Patel A; Perez-Padilla R; Pope D; Rylance J; Semple S; Martin WJ Respiratory risks from household air pollution in low and middle income countries. The Lancet Respiratory Medicine 2014;2:823–860 [DOI] [PMC free article] [PubMed] [Google Scholar]
- Hoppe Parr KA; Hađina S; Kilburg-Basnyat B; Wang Y; Chavez D; Thorne PS; Weiss JP Modification of sample processing for the Limulus amebocyte lysate assay enhances detection of inflammogenic endotoxin in intact bacteria and organic dust. Innate immunity 2017;23:307–318 [DOI] [PMC free article] [PubMed] [Google Scholar]
- Horne BD; Joy EA; Hofmann MG; Gesteland PH; Cannon JB; Lefler JS; Blagev DP; Korgenski EK; Torosyan N; Hansen GI; Kartchner D; Pope III CA. Short-term elevation of fine particulate matter air pollution and acute lower respiratory infection. American Journal of Respiratory and Critical Care Medicine 2018;198 [DOI] [PubMed] [Google Scholar]
- Hu G; Zhou Y; Tian J; Yao W; Li J; Li B; Ran P Risk of COPD from exposure to biomass smoke: a metaanalysis. Chest 2010;138:20–31 [DOI] [PubMed] [Google Scholar]
- Hulbert W; Forster B; Mehta J; Man S; Molday R; Walker B; Walker D; Hogg J Study of airway epithelial permeability with dextran. Journal of electron microscopy technique 1989;11:137–142 [DOI] [PubMed] [Google Scholar]
- Imbus HR; Suh MW Byssinosis. Archives of Environmental Health: An International Journal 1973;26:183–191 [DOI] [PubMed] [Google Scholar]
- Janssen NA; Hoek G; Simic-Lawson M; Fischer P; Van Bree L; Ten Brink H; Keuken M; Atkinson RW; Anderson HR; Brunekreef B Black Carbon as an Additional Indicator of the Adverse Health Effects of Airborne Particles Compared with PM10 and PM2.5. Environmental Health Perspectives 2011;119:1691–1699 [DOI] [PMC free article] [PubMed] [Google Scholar]
- Janssen NA; Joint W Health effects of black carbon edêds: WHO Regional Office for Europe Copenhagen; 2012
- Jenkins BM; Jones AD; Turn SQ; Williams RB Particle concentrations, gas-particle partitioning, and species intercorrelations for polycyclic aromatic hydrocarbons (PAH) emitted during biomass burning. Atmospheric Environment 1996;30:3825–3835 [Google Scholar]
- Jeronimo M; Stewart Q; Weakley AT; Giacomo J; Zhang X; Hyslop N; Dillner AM; Shupler M; Brauer M Analysis of black carbon on filters by image-based reflectance. Atmospheric Environment 2020:117300 [DOI] [PMC free article] [PubMed] [Google Scholar]
- Jindal S; Aggarwal A; Gupta D A review of population studies from India to estimate national burden of chronic obstructive pulmonary disease and its association with smoking. Indian J Chest Dis Allied Sci 2001;43:139–1471 [PubMed] [Google Scholar]
- Jones J; Lawler P; Crawley J; Minty B; Hulands G; Veall N Increased alveolar epithelial permeability in cigarette smokers. The Lancet 1980;315:66–68 [DOI] [PubMed] [Google Scholar]
- Kargin R; Kargin F; Mutlu H; Emiroglu Y; Pala S; Akcakoyun M; Aung SM; Baran R; Ozdemir N Long-term exposure to biomass fuel and its relation to systolic and diastolic biventricular performance in addition to obstructive and restrictive lung diseases. Echocardiography 2011;28:52–61 [DOI] [PubMed] [Google Scholar]
- Karp PH; Moninger TO; Pary Weber S; Nesselhauf TS; Launspach JL; Zabner J; Welsh MJ An in vitro model of differentiated human airway epithelia: methods for establishing primary cultures. Epithelial Cell Culture Protocols 2002:115–137 [DOI] [PubMed] [Google Scholar]
- Kesimer M; Kirkham S; Pickles RJ; Henderson AG; Alexis NE; DeMaria G; Knight D; Thornton DJ; Sheehan JK Tracheobronchial air-liquid interface cell culture: a model for innate mucosal defense of the upper airways? American Journal of Physiology-Lung Cellular and Molecular Physiology 2009;296:L92–L100 [DOI] [PMC free article] [PubMed] [Google Scholar]
- Kilburg-Basnyat B; Metwali N; Thorne PS Effect of deployment time on endotoxin and allergen exposure assessment using electrostatic dust collectors. Annals of Occupational Hygiene 2014;59:104–115 [DOI] [PMC free article] [PubMed] [Google Scholar]
- Kilburg-Basnyat B; Metwali N; Thorne PS Performance of electrostatic dust collectors (EDCs) for endotoxin assessment in homes: effect of mailing, placement, heating, and electrostatic charge. Journal of occupational and environmental hygiene 2016;13:85–93 [DOI] [PMC free article] [PubMed] [Google Scholar]
- Kilburg-Basnyat B; Peters TM; Perry SS; Thorne PS Electrostatic dust collectors compared to inhalable samplers for measuring endotoxin concentrations in farm homes. Indoor Air 2016;26:724–733 [DOI] [PMC free article] [PubMed] [Google Scholar]
- Kurmi OP; Semple S; Simkhada P; Smith WCS; Ayres JG COPD and chronic bronchitis risk of indoor air pollution from solid fuel: a systematic review and metaanalysis. Thorax 2010;65:221–228 [DOI] [PubMed] [Google Scholar]
- LeSimple P; Liao J; Robert R; Gruenert DC; Hanrahan JW Cystic fibrosis transmembrane conductance regulator trafficking modulates the barrier function of airway epithelial cell monolayers. The Journal of physiology 2010;588:1195–1209 [DOI] [PMC free article] [PubMed] [Google Scholar]
- Local Particulate Air Pollution (PM2.5), Thanjavur, Tamil Nadu, India. ©2016–2020, Berkeley Earth. Berkeley Earth; [Accessed 2020 Apr 9]. http://berkeleyearth.lbl.gov/air-quality/local/India/Tamil_Nadu/Thanjavur.
- Madsen AM; Matthiesen CB; Frederiksen MW; Frederiksen M; Frankel M; Spilak M; Gunnarsen L; Timm M Sampling, extraction and measurement of bacteria, endotoxin, fungi and inflammatory potential of settling indoor dust. Journal of Environmental Monitoring 2012;14:3230–3239 [DOI] [PubMed] [Google Scholar]
- Mazumdar M; Christiani DC; Biswas SK; Ibne-Hasan OS; Kapur K; Hug C Elevated sweat chloride levels due to arsenic toxicity. New England Journal of Medicine 2015;372:582–584 [DOI] [PMC free article] [PubMed] [Google Scholar]
- Mazumder DNG; Haque R; Ghosh N; De BK; Santra A; Chakraborti D; Smith AH Arsenic in drinking water and the prevalence of respiratory effects in West Bengal, India. International Journal of Epidemiology 2000;29:1047–1052 [DOI] [PubMed] [Google Scholar]
- Mendy A; Salo PM; Cohn RD; Wilkerson J; Zeldin DC; Thorne PS House dust endotoxin association with chronic bronchitis and emphysema. Environmental health perspectives 2018;126:037007. [DOI] [PMC free article] [PubMed] [Google Scholar]
- Molina SA; Stauffer B; Moriarty HK; Kim AH; McCarty NA; Koval M Junctional abnormalities in human airway epithelial cells expressing F508del CFTR. American Journal of Physiology-Lung Cellular and Molecular Physiology 2015;309:L475–L487 [DOI] [PMC free article] [PubMed] [Google Scholar]
- Mukherjee S; Roychoudhury S; Siddique S; Banerjee M; Bhattacharya P; Lahiri T; Ray MR Respiratory symptoms, lung function decrement and chronic obstructive pulmonary disease in pre-menopausal Indian women exposed to biomass smoke. Inhalation Toxicology 2014;26:866–872 [DOI] [PubMed] [Google Scholar]
- Ni L; Chuang C-C; Zuo L Fine particulate matter in acute exacerbation of COPD. Frontiers in Physiology 2015;6:294. [DOI] [PMC free article] [PubMed] [Google Scholar]
- Norris A; Jackson D Sulphur dioxide-induced airway hyperreactivity and pulmonary inflammation in dogs. Agents and actions 1989;26:360–366 [DOI] [PubMed] [Google Scholar]
- Noss I; Wouters IM; Bezemer G; Metwali N; Sander I; Raulf-Heimsoth M; Heederik DJ; Thorne PS; Doekes G β-(1, 3)-Glucan exposure assessment by passive airborne dust sampling and new sensitive immunoassays. Appl Environ Microbiol 2010;76:1158–1167 [DOI] [PMC free article] [PubMed] [Google Scholar]
- Noss I; Wouters IM; Visser M; Heederik DJ; Thorne PS; Brunekreef B; Doekes G Evaluation of a low-cost electrostatic dust fall collector for indoor air endotoxin exposure assessment. Applied and Environmental Microbiology 2008;74:5621–5627 [DOI] [PMC free article] [PubMed] [Google Scholar]
- Özbay B; Uzun K.s.; Arslan H; Zehir I.s. Functional and radiological impairment in women highly exposed to indoor biomass fuels. Respirology 2001;6:255–258 [DOI] [PubMed] [Google Scholar]
- Pope III CA; Burnett RT; Thun MJ; Calle EE; Krewski D; Ito K; Thurston GD Lung cancer, cardiopulmonary mortality, and long-term exposure to fine particulate air pollution. JAMA 2002;287:1132–1141 [DOI] [PMC free article] [PubMed] [Google Scholar]
- Quanjer PH; Tammeling G; Cotes J; Pedersen O; Peslin R; Yernault J Lung volumes and forced ventilatory flows. Eur Respiratory Soc; 1993 [DOI] [PubMed] [Google Scholar]
- Rabe KF; Hurd S; Anzueto A; Barnes PJ; Buist SA; Calverley P; Fukuchi Y; Jenkins C; Rodriguez-Roisin R; Van Weel C Global strategy for the diagnosis, management, and prevention of chronic obstructive pulmonary disease: GOLD executive summary. American journal of respiratory and critical care medicine 2007;176:532–555 [DOI] [PubMed] [Google Scholar]
- Reddy MS; Venkataraman C Inventory of aerosol and sulphur dioxide emissions from India. Part II—biomass combustion. Atmospheric Environment 2002;36:699–712 [Google Scholar]
- Salvi S; Barnes PJ Is exposure to biomass smoke the biggest risk factor for COPD globally? Chest 2010;138:3–6 [DOI] [PubMed] [Google Scholar]
- Schwartz DA; Thorne PS; Jagielo PJ; White GE; Bleuer SA; Frees KL Endotoxin responsiveness and grain dust-induced inflammation in the lower respiratory tract. American Journal of Physiology-Lung Cellular and Molecular Physiology 1994;267:L609–L617 [DOI] [PubMed] [Google Scholar]
- Semple S; Devakumar D; Fullerton DG; Thorne PS; Metwali N; Costello A; Gordon SB; Manandhar DS; Ayres JG Airborne endotoxin concentrations in homes burning biomass fuel. Environmental health perspectives 2010;118:988–991 [DOI] [PMC free article] [PubMed] [Google Scholar]
- Serikov VB; Choi H; Chmiel KJ; Wu R; Widdicombe JH Activation of extracellular regulated kinases is required for the increase in airway epithelial permeability during leukocyte transmigration. American Journal of Respiratory Cell and Molecular Biology 2004;30:261–270 [DOI] [PubMed] [Google Scholar]
- Silbajoris R; Ghio AJ; Samet JM; Jaskot R; Dreher KL; Brighton LE In vivo and in vitro correlation of pulmonary MAP kinase activation following metallic exposure. Inhalation toxicology 2000;12:453–468 [DOI] [PubMed] [Google Scholar]
- Stapleton EM; Manges R; Parker G; Stone EA; Peters TM; Blount RJ; Noriega J; Li X; Zabner J; Polgreen PM Indoor particulate matter from smoker homes induces bacterial growth, biofilm formation and impairs airway antimicrobial activity. A pilot study. Frontiers in Public Health 2019;7:418. [DOI] [PMC free article] [PubMed] [Google Scholar]
- Strak M; Janssen NA; Godri KJ; Gosens I; Mudway IS; Cassee FR; Lebret E; Kelly FJ; Harrison RM; Brunekreef B; Steenhof M; Hoek G Respiratory health effects of airborne particulate matter: The role of particle size, composition, and oxidative potential-the RAPTES project. Environmental Health Perspectives 2012;120:1183–1189 [DOI] [PMC free article] [PubMed] [Google Scholar]
- Tamaoki J; Chiyotani A; Sakai N; Takeyama K; Konno K Effect of azelastine on sulphur dioxide induced impairment of ciliary motility in airway epithelium. Thorax 1993;48:542–546 [DOI] [PMC free article] [PubMed] [Google Scholar]
- Thorne PS; Kulhánková K; Yin M; Cohn R; Arbes SJ Jr; Zeldin DC Endotoxin exposure is a risk factor for asthma: the national survey of endotoxin in United States housing. American journal of respiratory and critical care medicine 2005;172:1371–1377 [DOI] [PMC free article] [PubMed] [Google Scholar]
- Thorne PS; Mendy A; Metwali N; Salo P; Co C; Jaramillo R; Rose KM; Zeldin DC Endotoxin exposure: predictors and prevalence of associated asthma outcomes in the United States. American journal of respiratory and critical care medicine 2015;192:1287–1297 [DOI] [PMC free article] [PubMed] [Google Scholar]
- Tobias A; Karanasiou A; Reche C; Amato F; Alastuey A; Querol X Effects of black carbon on respiratory health in the city of Barcelona. European Respiratory Journal 2014;44:2923 [Google Scholar]
- Tockman M; Baser M Is cotton dust exposure associated with chronic effects? : American Lung Association; 1984 [DOI] [PubMed] [Google Scholar]
- Van Itallie CM; Anderson JM The molecular physiology of tight junction pores. Physiology 2004;19:331–338 [DOI] [PubMed] [Google Scholar]
- Vogelmeier CF; Criner GJ; Martinez FJ; Anzueto A; Barnes PJ; Bourbeau J; Celli BR; Chen R; Decramer M; Fabbri LM Global strategy for the diagnosis, management, and prevention of chronic obstructive lung disease 2017 report. GOLD executive summary. American journal of respiratory and critical care medicine 2017;195:557–582 [DOI] [PubMed] [Google Scholar]
- Vogelzang PF; Van der Gulden JW; Folgering H; Kolk JJ; Heederik D; Preller L; Tielen MJ; Van Schayck CP Endotoxin exposure as a major determinant of lung function decline in pig farmers. American Journal of Respiratory and Critical Care Medicine 1998;157:15–18 [DOI] [PubMed] [Google Scholar]
- WHO. World Health Organization, Chronic respiratory diseases: Burden of COPD
- WHO. WHO Air quality guidelines for particulate matter, ozone, nitrogen dioxide and sulfur dioxide: global update 2005: summary of risk assessment. Geneva: World Health Organization; 2006 [PubMed] [Google Scholar]
- Xing Y-F; Xu Y-H; Shi M-H; Lian Y-X The impact of PM2.5 on the human respiratory system. Journal of Thoracic Disease 2016;8:E69. [DOI] [PMC free article] [PubMed] [Google Scholar]
- Zabner J; Karp P; Seiler M; Phillips SL; Mitchell CJ; Saavedra M; Welsh M; Klingelhutz AJ Development of cystic fibrosis and noncystic fibrosis airway cell lines. American Journal of Physiology-Lung Cellular and Molecular Physiology 2003;284:L844–L854 [DOI] [PubMed] [Google Scholar]
- Zanobetti A; Franklin M; Koutrakis P; Schwartz J Fine particulate air pollution and its components in association with cause-specific emergency admissions. Environmental Health 2009;8:58. [DOI] [PMC free article] [PubMed] [Google Scholar]
- Zelikoff JT; Schermerhorn KR; Fang K; Cohen MD; Schlesinger RB A role for associated transition metals in the immunotoxicity of inhaled ambient particulate matter. Environmental Health Perspectives 2002;110:871–875 [DOI] [PMC free article] [PubMed] [Google Scholar]
Associated Data
This section collects any data citations, data availability statements, or supplementary materials included in this article.