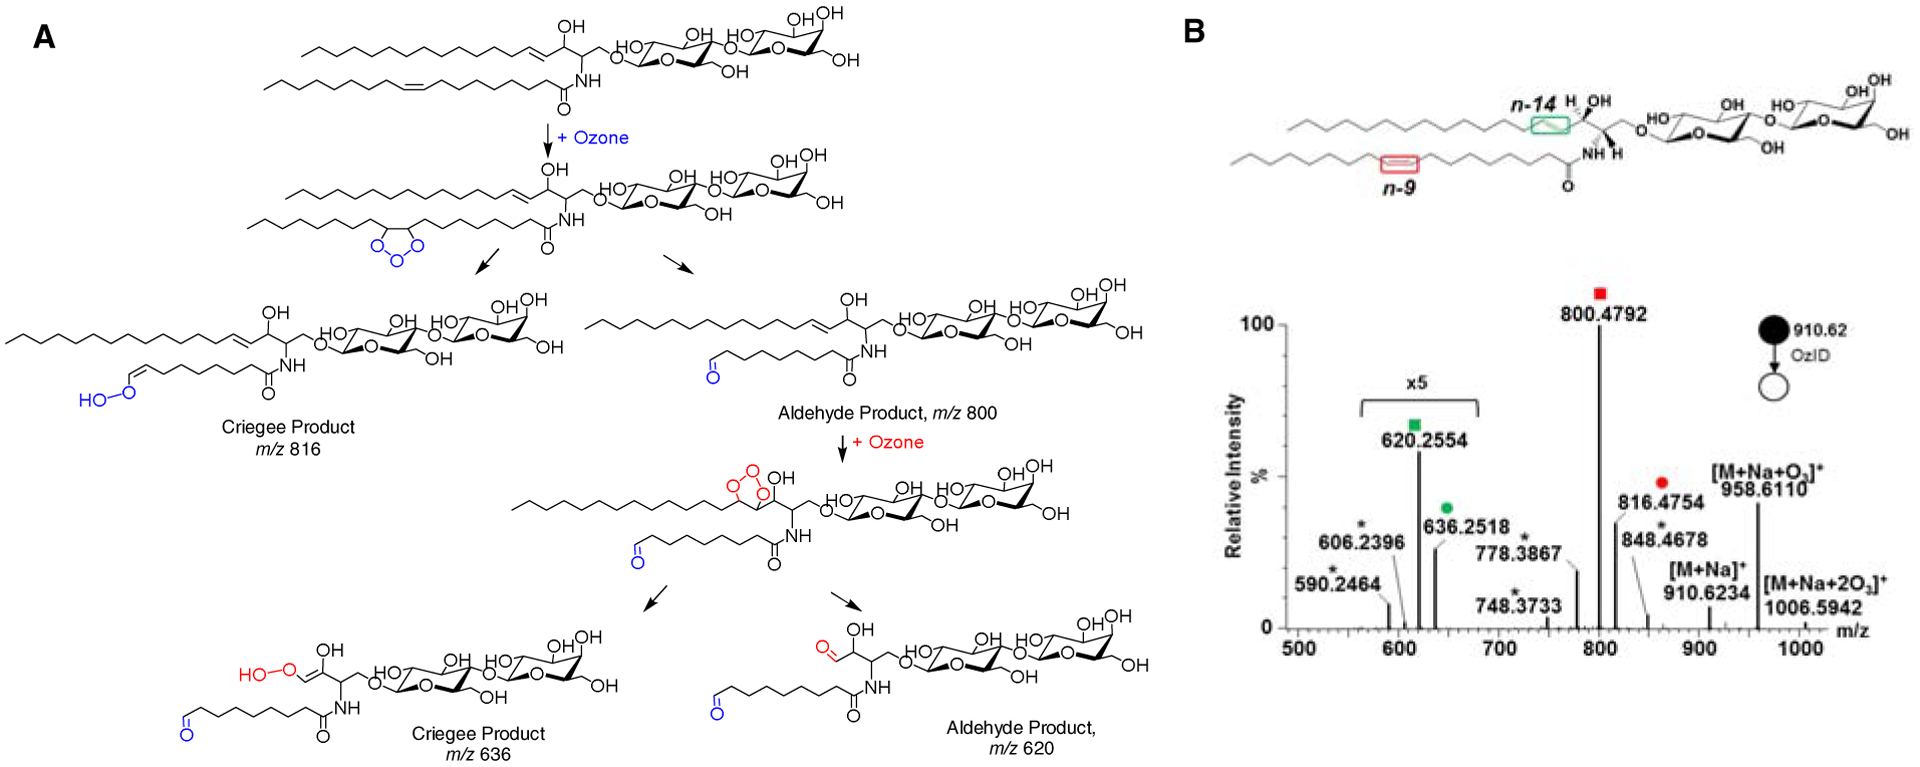
Figure 9. Gas-phase ozonolysis of LacCer d18:1/18:1(9Z) in a modified mass spectrometer.

A) Proposed reaction pathway showing selective cleavage of carbon-carbon double bonds producing Criegee and aldehyde ions. B) OzID-MS spectrum showing the Criegee and aldehyde product ions are depicted as (●) and (■), respectively. Open square (□) and circle (○) indicate ions generated through the elimination of H2C=O from the aldehyde ion and Criegee ion, respectively. Mass differences (neutral losses) between the precursor ion and Criegee/aldehyde ions are used to pinpoint the location of double bonds. Asterisk (*) indicates ions generated through secondary oxidation from [M+Na+O3]+. Colors represent different double bond locations. Reprinted with permission from Barrientos R.C. et al. J. Am. Soc. Mass Spectrom., 28, 2330–2343 (2017)[67] © American Society for Mass Spectrometry.
