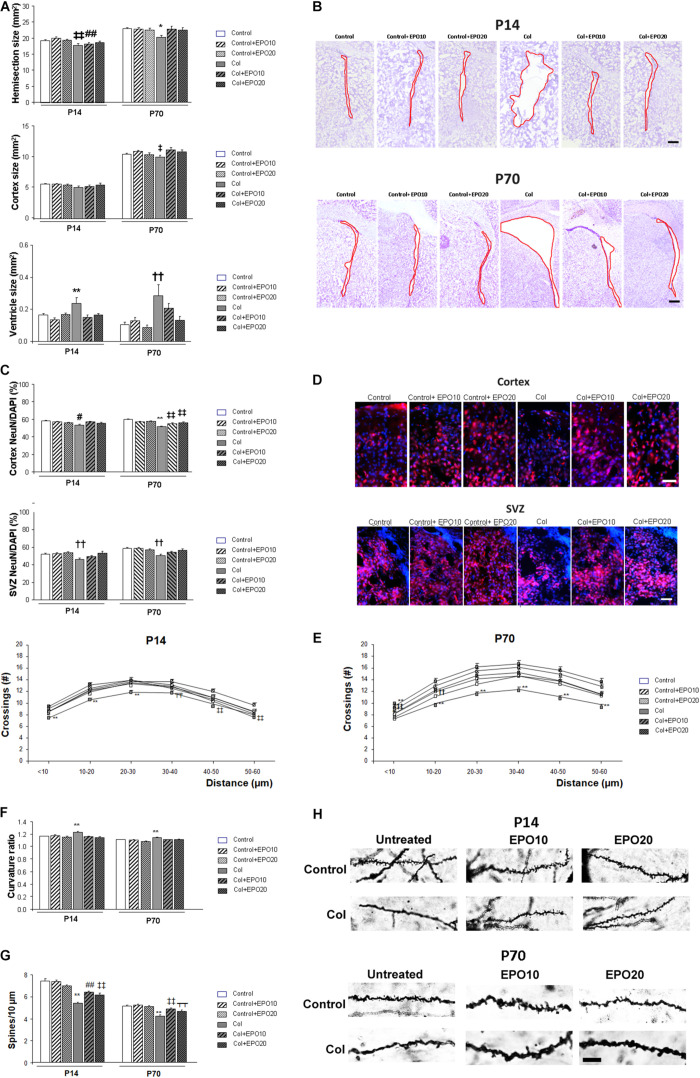
FIGURE 2.
EPO treatment limits brain atrophy and neuronal alterations after induction of a GM-IVH with Col. (A) Ipsilateral hemisection size was reduced in P14 and P70 mice while EPO treatment limited this effect (P14: ‡‡p = 0.003 vs. Control, Control + EPO10 and Control + EPO20, ##p = 0.003 vs. Control + EPO10; P70: *p = 0.017 vs. rest of the groups). Differences observed in the cortex did not reach statistical significance at P14 (p = 0.358), although at P70 cortical compromise was ameliorated by EPO treatment (‡p = 0.014 vs. Control and Col + EPO10). Significant ventricle enlargement was detected at P14 and EPO treatment reversed this effect (**p = 0.001 vs. rest of the groups) and a similar profile was observed at P70 (††p = 0.001 vs. Control, Control + EPO10, Control + EPO20, Col + EPO20). (B) Illustrative example of cresyl violet staining showing the ipsilateral ventricle enlargement at P14 and P70, after inducing a GM-IVH, while ventricle size is maintained in mice treated with EPO. Red line borders the ventricle. Scale bar = 250 μm. (C) At P14, NeuN/DAPI ratio was reduced in the ipsilateral cortex and EPO treatment improved this situation (#p = 0.034 vs. Control, Control + EPO10 and Col + EPO10). A similar profile was observed at P70 (**p < 0.001 vs. rest of the groups, ‡‡p < 0.01 vs. Control, Control + EPO10 and Control + EPO20). The SVZ was also affected after Col lesions and EPO treatment significantly improved the NeuN/DAPI ratio both at P14 and P70 (P14: ††p = 0.002 vs. Control, Control + EPO10, Control + EPO20 and Col + EPO20; P70: ††p = 0.002 vs. Control, Control + EPO10, Control + EPO20 and Col + EPO20; P70). (D) Illustrative example of NeuN (red)/DAPI (blue) staining in the ipsilateral cortex and SVZ from mice with GM-IVH induced by Col, where a reduction in NeuN+cells can be observed, while more NeuN+cells are detected after EPO10 and EPO20 treatment. Scale 50 μm. (E) Neuronal complexity was affected by Col lesions and EPO treatment significantly improved this effect at P14 (**p < 0.01 vs. rest of the groups; ‡p = 0.017 vs. Cont + EPO20; ‡‡p = 0.003 vs. Cont + EPO20; T̄T̄p < 0.01 vs. rest Control and Cont + EPO20) or P70 (**p < 0.01 vs. rest of the groups, ‡‡p < 0.01 vs. Control, Control + EPO20; ††p < 0.01 vs. Control + EPO20, Col + EPO10 and Col + EPO20). (F) Neuron curvature ratio was also impaired after Col lesions and EPO treatment significantly ameliorated this situation both at P14 (**p < 0.01 vs. rest of the groups) and P70 (**p < 0.01 vs. rest of the groups). (G) Spine density compromise was also limited after EPO treatment in the ipsilateral hemispheres at P14 (**p < 0.01 vs. rest of the groups, ‡‡p < 0.01 vs. Control, Control + EPO10 and Control + EPO20, ##p < 0.01 vs. Control and Control + EPO10) and at P70 (**p < 0.01 vs. rest of the groups, ‡‡p < 0.01 vs. Control, Control + EPO10 and Control + EPO20, ⊺⊺p < 0.01 vs. Control + EPO10). (H) Illustrative example of spines labeled by Golgi-Cox staining. A reduction in spine density is observed in mice after lesions with Col and this effect is limited by EPO10 and EPO20 treatment at P14 and P70. Scale = 12.5 μm.

