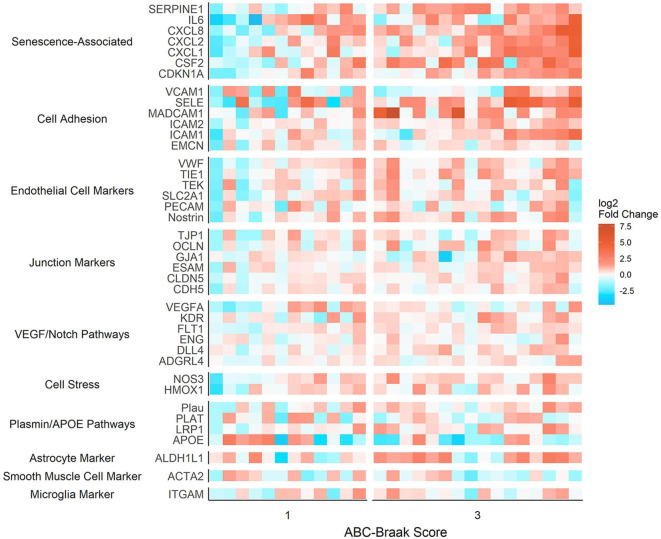
Figure 1.
Senescence-associated genes form a fold change hotspot in prefrontal cortex microvessels isolated from high-Braak (B3) vs. low-Braak (B1) samples. Differential gene expression between microvessels isolated from B3 vs. B1 samples, grouped by hypothesis-driven gene function groups. Values reflect log2-transformed fold change values relative to the B1 subject mean expression per gene. Relative quantification was performed such that the mean of B1 fold changes is zero for each gene. For this visualization, missing data were imputed with the ABC-Braak group mean fold change for the gene.

