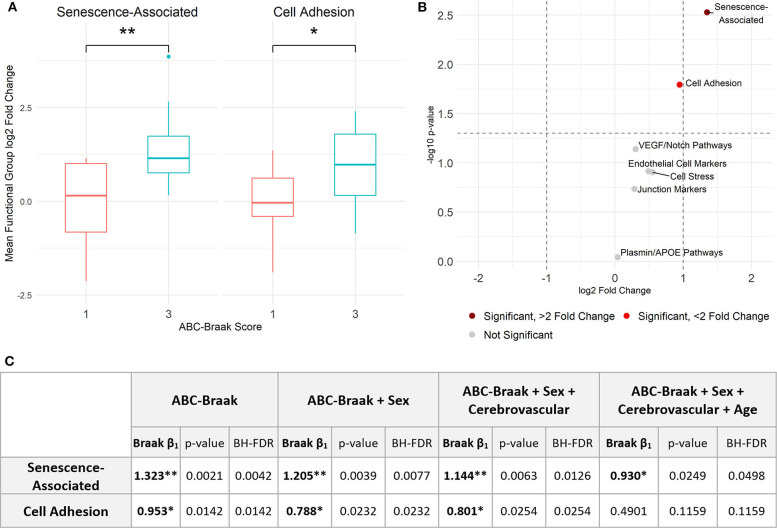
Figure 2.
Senescence- and adhesion-associated genes are significantly upregulated in prefrontal cortex microvessels isolated from B3 vs. B1 subjects. (A) Senescence-associated genes are significantly upregulated in B3 cerebral microvessels with a log2 fold change of 1.323; Welch's unpaired t-test, p = 0.0030 (BH-corrected FDR 0.0208), 95% CI for B3 log2 fold change: 0.5019, 2.1442. Cell adhesion genes are also significantly upregulated with a log2 fold change of 0.953; Welch's unpaired t-test, p = 0.0161 (BH-FDR 0.0562), 95% CI for B3 log2 fold change: 0.1945, 1.7123. (B) Volcano plot showing t-test results. Dashed vertical lines denote magnitudes of 2-fold change and the dashed horizontal line denotes the cutoff for p < 0.05. (C) Stepwise multiple regression models were applied to senescence-associated and cell adhesion functional groups to measure the association between Braak stage and functional group average fold change. The first row indicates the independent variables upon which the average fold change was regressed per model for each functional group. Within each model, the ABC-Braak term regression coefficient (β1), p-value, and BH-FDR are reported. Significant ABC-Braak β1 terms are denoted with **p < 0.01, *p < 0.05.

