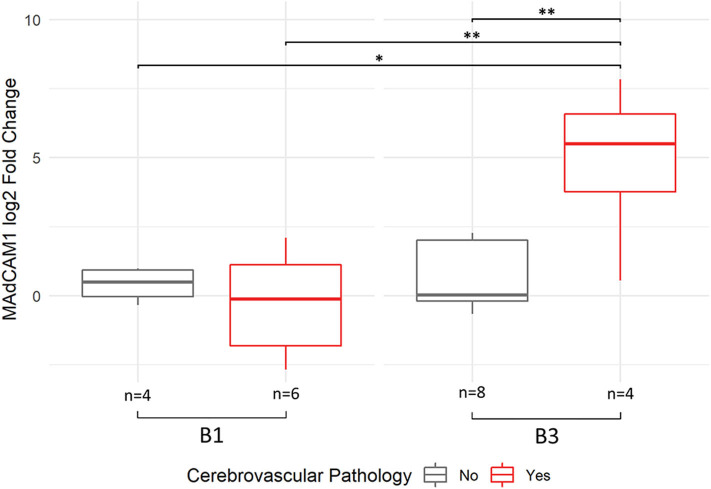
Figure 4.
MAdCAM-1 upregulation demonstrates interaction between Braak stage and presence of cerebrovascular pathology. ANOVA with interaction demonstrated significant interaction between a high Braak score (B3) and presence of cerebrovascular pathology in MAdCAM1 expression out of all 40 genes quantified. Data shown in the boxplot reflect Tukey's HSD post-hoc test results, with **p < 0.01, *p < 0.05. A total of 6 samples did not have detectable expression, with an even distribution of missing data across the four groups. The number of samples with detected MAdCAM-1 expression per group are indicated at the bottom of the boxes.

