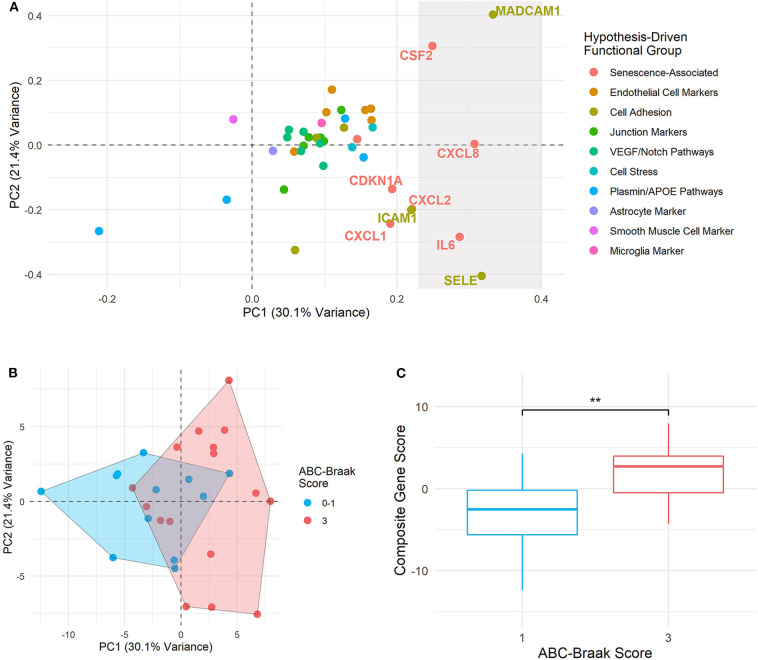
Figure 5.
Principal component composite gene scores in B3 vs. B1 microvessels show variance driven by senescence and adhesion genes. (A) PC loadings are plotted for each gene in PC1 (x-axis) and PC2 (y-axis). The rightmost shaded region contains the genes considered to be top contributors to PC1, with their percent contribution at least one standard deviation above the mean contribution. Genes immediately adjacent to this top contributor subset are also labeled. Point and text colors correspond to each gene's hypothesis-driven functional group, listed on the right. (B) Samples are plotted by PC1 and PC2 composite gene fold change scores, with geometric encircling to outline B1 vs. B3 group boundaries. (C) Boxplots show PC1 composite gene fold change scores in B1 vs. B3 PFC microvessels. Welch's unpaired t-test was applied to compare B1 and B3 composite scores, with ** indicating p < 0.01. Composite gene fold change scores are significantly larger in B3 vs. B1 microvessels (p = 0.0064, 95% CI: [1.477, 7.956]).

