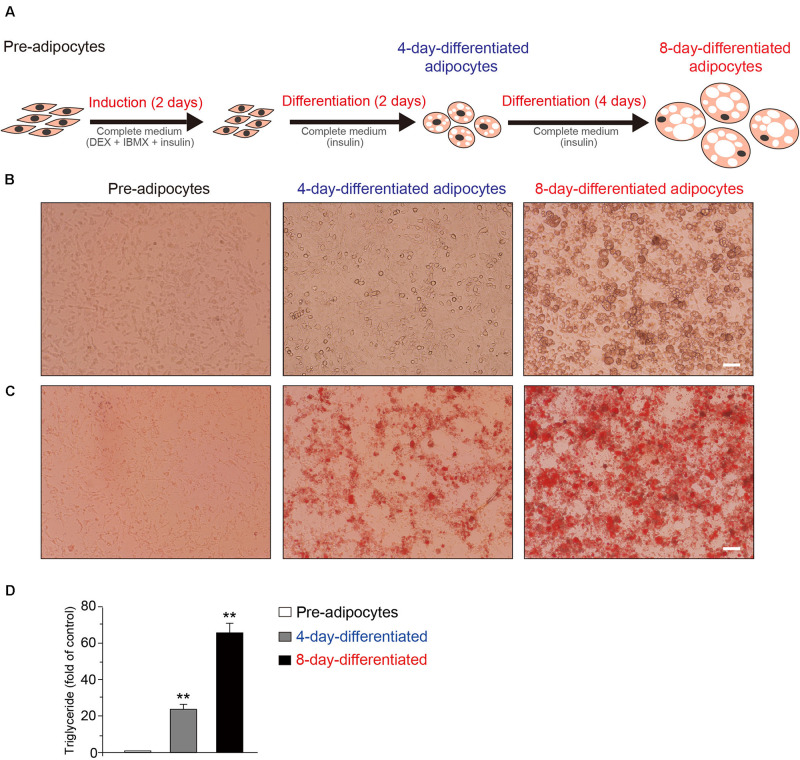
FIGURE 1.
The schematic of the differentiation of 3T3-L1 adipocytes. (A) Induction of 3T3-L1 adipocyte differentiation by DEX and IBMX initially results in cell growth. The representative phase contrast (B) and oil red O staining (C) Images of 3T3-L1 cells at the preadipocyte, 4-day-differentiated, and 8-day-differentiated adipocyte stages. Scale bar: 100 μm. (D) The quantitative results of oil red O staining images of 3T3-L1 cells at the preadipocyte, 4-day-differentiated, and 8-day-differentiated adipocyte stages. Mean ± SEM, n = 6, **P < 0.01. One-way ANOVA followed by two-tailed t-test with Bonferroni correction.

