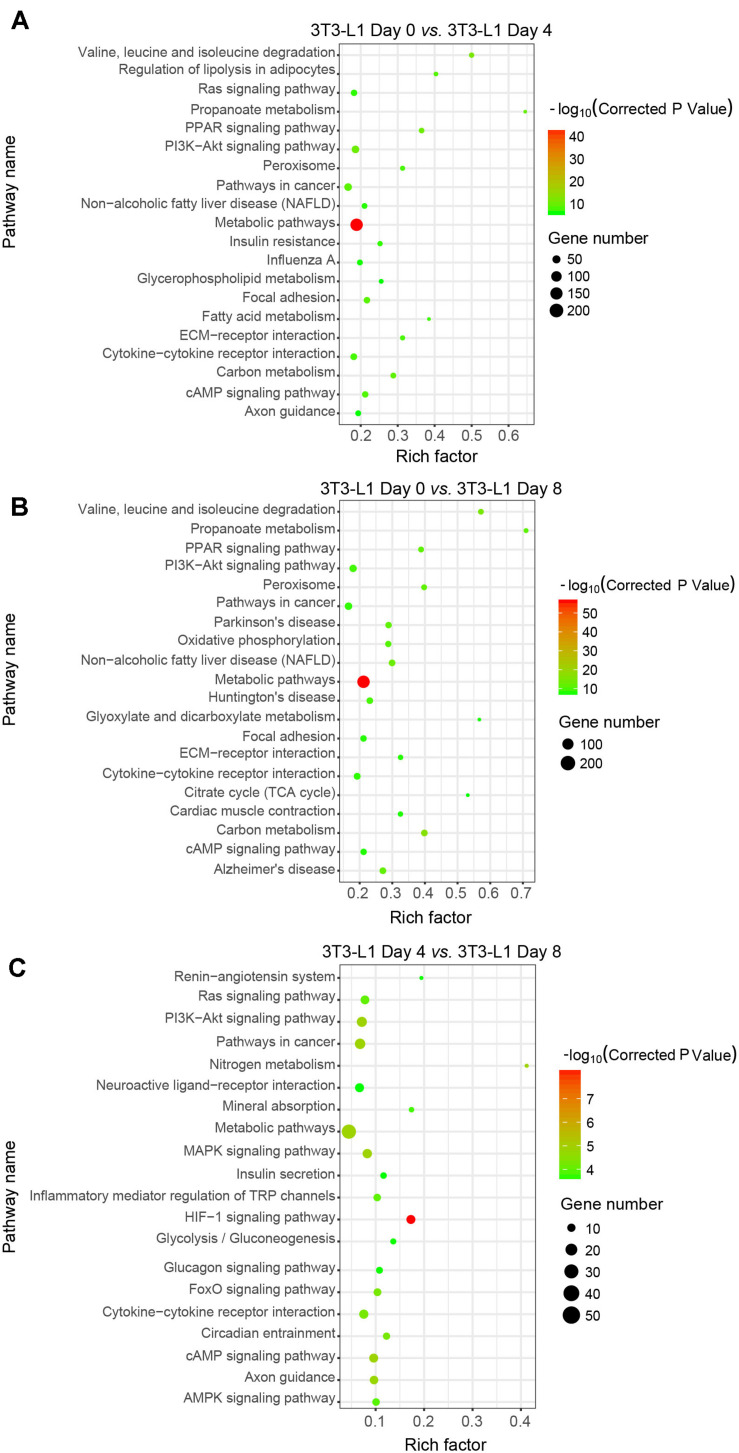
FIGURE 4.
Kyoto Encyclopedia of Genes and Genomes classifications of DEGs in 3T3-L1 adipocytes from different stages. (A–C) The comparison of pathway enrichment in 3T3-L1 adipocytes from different stages. It shows the top 20 significantly enriched KEGG pathways. The rich factor as the abscissa and the KEGG terms as the ordinate are plotted.

