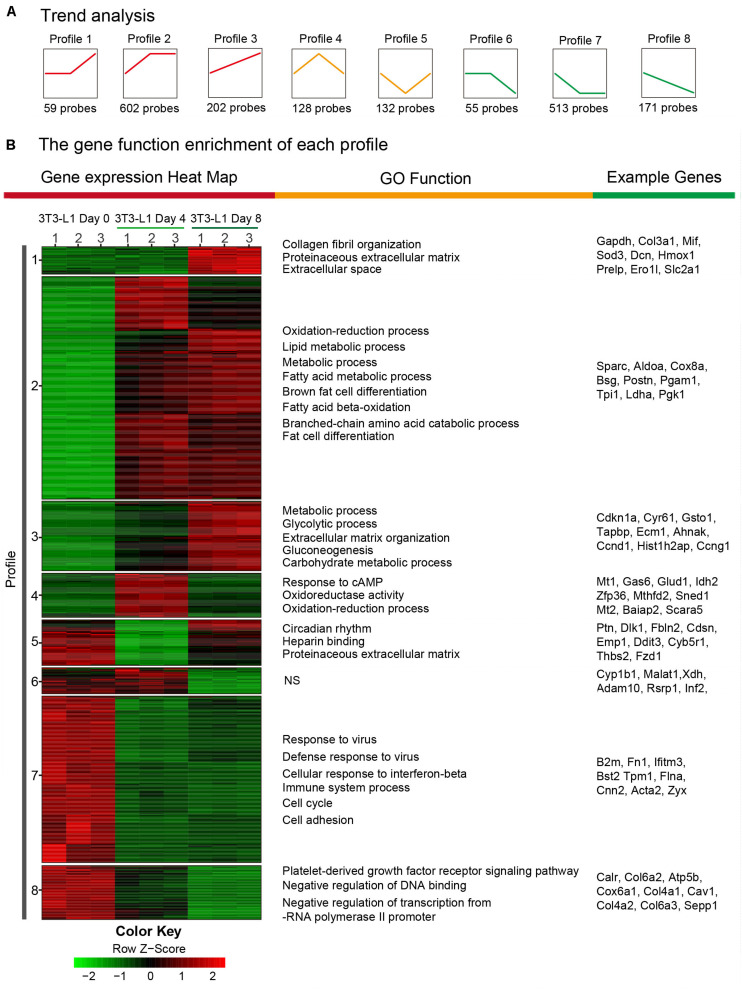
FIGURE 5.
Trend analysis of DEGs in 3T3-L1 adipocytes from different stages. (A) A sketch map of the cluster analysis of DEGs. The number at the bottom of each cluster represents the number of DEGs in the cluster. (B) A transcription heatmap with K-means of the mRNA expression in the 3T3-L1 adipocytes from different stages and the GO classification of each cluster is shown. Color annotation of the heatmap is shown in the bottom color scale. Upregulated or downregulated genes are represented by red or green bars.

