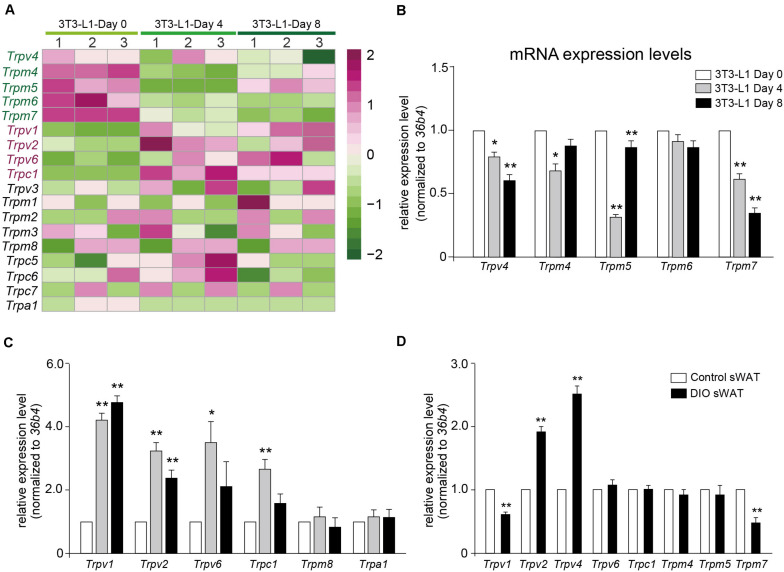
FIGURE 6.
Validation of TRP channels by quantitative real-time PCR. (A) A transcription heatmap of the mRNA expression of transient receptor potential (TRP) channels in 3T3-L1 adipocytes. Color scale is shown in the right side. Upregulated or downregulated genes are represented by red or green bars. (B,C) The mRNA expression levels of Trpv4, Trpm4, Trpm5, Trpm6, Trpm7, Trpv1, Trpv2, Trpv6, Trpc1, Trpm8, and Trpa1 in 3T3-L1 adipocytes from different differentiation stages. Mean ± SEM, n = 8, **P < 0.01. One-way ANOVA followed by two-tailed t-test with Bonferroni correction. (D) The mRNA expression levels of Trpv1, Trpv2, Trpv4, Trpv6, Trpc1, Trpm4, Trpm5, and Trpm7 in subcutaneous white adipose tissue (sWAT) from control mice and diet-induced obesity mice. Mean ± SEM, n = 6, *P < 0.05, **P < 0.01. Unpaired Student’s t-test.

