FIGURE 7.
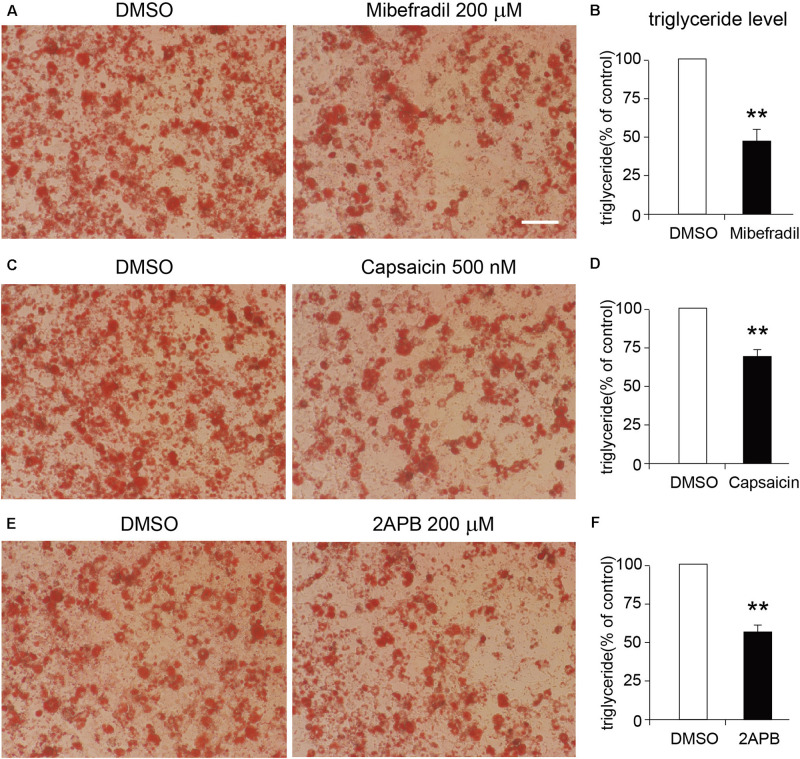
Effects of TRP channel agonists on the differentiation of 3T3-L1 cells. (A,C,E) The representative oil red O staining images of 8-day-differentiated 3T3-L1 adipocytes treated with DMSO or each TRP channel agonist, respectively. Scale bar indicates 100 μm. (B,D,F) The quantitative results of the oil red O staining images of 8-day-differentiated 3T3-L1 adipocytes treated with DMSO or each TRP channel agonist. Mean ± SEM, n = 8, **P < 0.01. Unpaired Student’s t-test.

