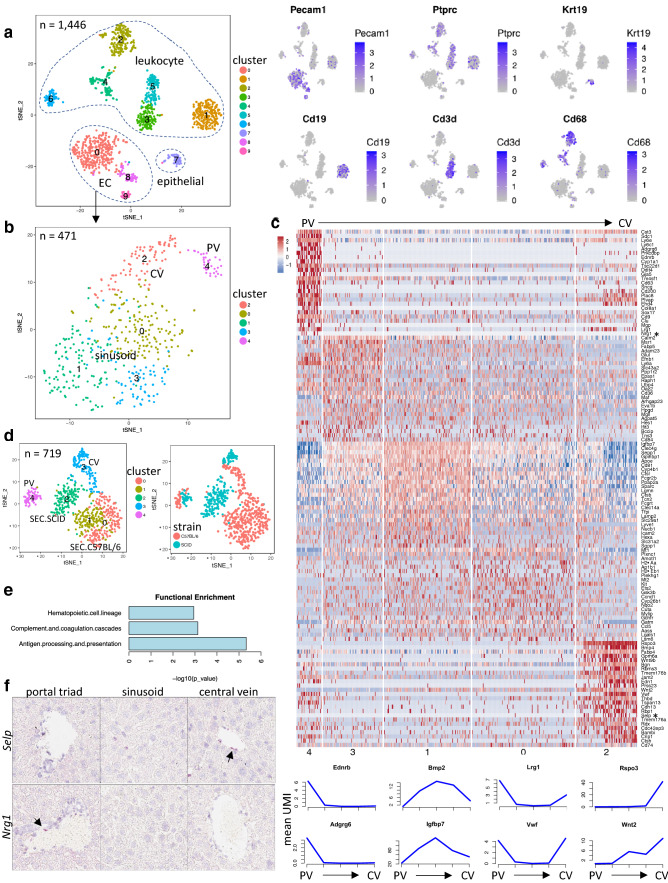
Fig. 1.
Molecular heterogeneity of endothelial cells (ECs) in normal liver. a Left, t-SNE plot showing clusters identified from 1,446 cells collected from normal C57BL/6 mouse liver tissue. Right, expression of cell-type marker genes in the t-SNE plot. Expression level UMI in natural log scale: blue, high; gray, low. b Further clustering of ECs in the C57BL/6 normal liver. Five subpopulations detected including sinusoid (clusters 0, 1 and 3), central vein (CV, cluster 2) and portal vein (PV, cluster 4). c Upper, heatmap of EC subpopulation-specific genes. Liver EC subpopulations are arranged in a zonation order from PV to CV based on a few well-established zonation markers such as Rspo3, Wnt2 and Msr1 etc. The numbers below in the heatmap correspond to cluster numbers as in 1b. Asterisk, two genes chosen to be validated by RNAScope (see 1f). Lower, expression profile (mean UMI within the cluster) of selected zonation genes by line plot linking points representing five clusters in the same order as in the heatmap above. d t-SNE plot of combined normal liver ECs from C57BL/6 and SCID mice. Left, colored by identified clusters; Right, colored by strain background. e Functional enrichment of genes preferentially expressed in liver sinusoid of C57BL/6 compared to SCID mice. f RNAScope validation of a novel central vein marker (Selp) and a novel portal vein marker (Nrg1) in normal liver from SCID mice. CV, central vein; PV, portal vein; SEC, sinusoid endothelial cells

