Fig. 2.
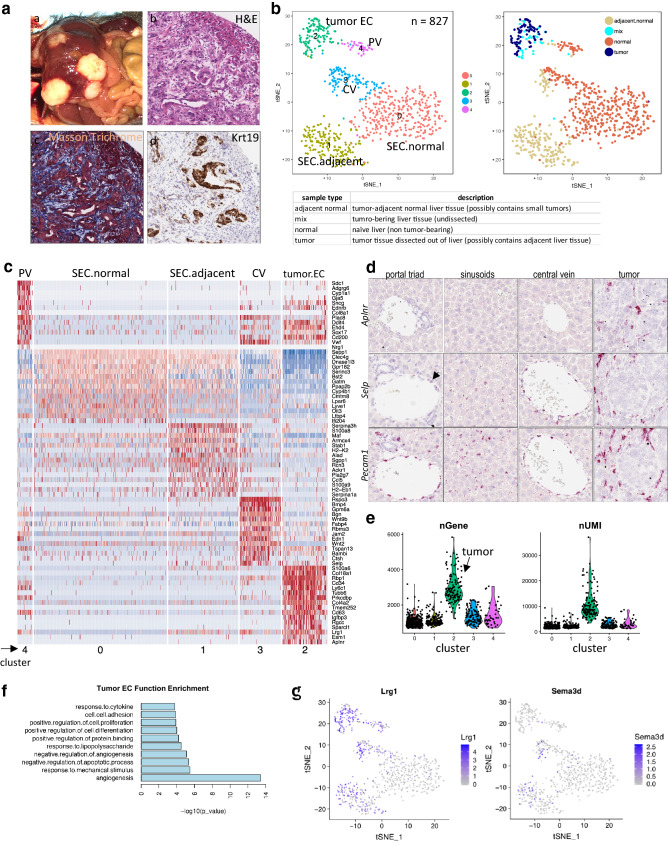
Distinct tumor EC and adjacent normal EC subpopulations in tumor-bearing liver tissues. a Characterization of HDD-induced intrahepatic tumors. (a) Gross image of liver harboring multiple HDD-induced tumors. Histological features of HDD-induced tumors by H&E (b), Masson Trichrome (c) and keratin 19 (Krt19) RNAScope (d) at × 20 magnification. b t-SNE plot of combined ECs collected from normal liver, dissected tumor, tumor-adjacent normal and undissected tumor-bearing liver (tumor and adjacent normal combined) tissue from C57BL/6 mice. Left, single cells colored by identified clusters; Right, cells colored by sample type. Bottom, nomenclature of sample types. c Heatmap of top 15 EC cluster-specific genes. Clusters (corresponding to the t-SNE plot in 2b) were annotated based on both known EC marker genes and sample type. d RNAScope on intrahepatic tumors and adjacent normal liver tissues of SCID mice showing tumor-specific expression of Aplnr and upregulation of Selp in sinusoid and PV (see naïve normal tissue expression in Fig. 1f for comparison). Pecam1 was used as pan-EC marker. e. Gene and UMI counts across clusters (corresponding to t-SNE plot in 2b). f Functional enrichment (GO terms) of genes preferentially expressed (upregulated) in tumor ECs compared to non-tumor liver ECs. g Feature plot showing upregulation of Lrg1 and Sema3d in adjacent normal ECs compared to naïve ECs (corresponding to EC cluster t-SNE plot in b)

