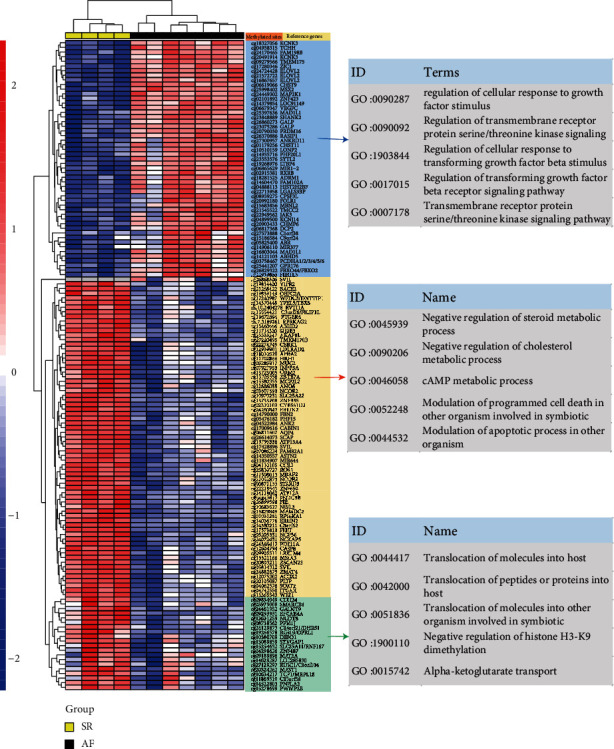
Figure 2.

The detection of differential methylation regions and identification of Gene Ontology (GO) enrichment for the comparisons between AF and SR. This figure presents the results of differential methylation sites and GO function enrichment for referenced genes. Red represents higher expression; blue represents lower expression.
