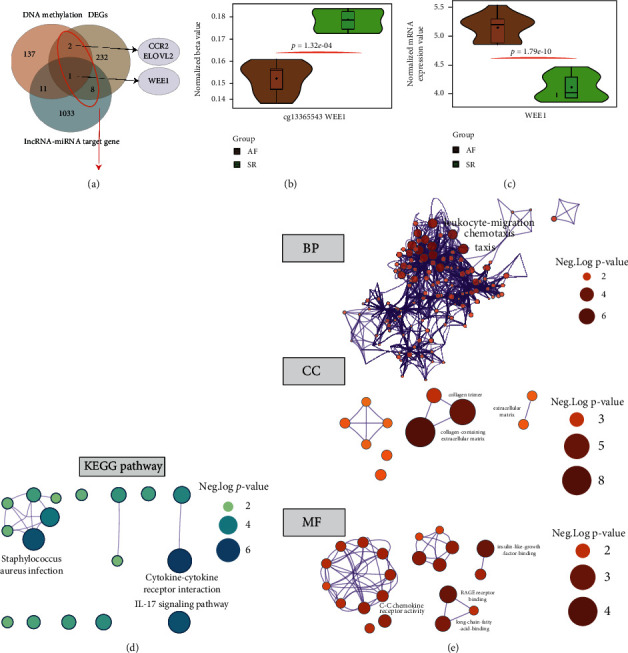
Figure 3.

The identification of hub genes and gene function enrichment analysis for the integrative analysis between transcriptome and DNA methylation analysis. (a) The overlap detection among the differentially expressed lncRNA-miRNA target gene, DNA methylation gene, and differential expressed mRNA. (b, c) The expression analysis of hub methylation site and mRNA. (d) The KEGG pathway enrichment based on GSEA analysis. The size of the dots represents the neg. (e) The results of GO function enrichment for differentially expressed genes. The size of the nodes represents the value of neg.
