Figure 3.

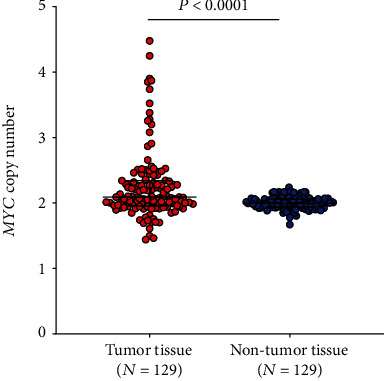
Distribution of MYC copy numbers in tumor and adjacent nontumor tissues from 129 patients. The Mann-Whitney U test was performed to examine group differences. Vertical bars indicate median and interquartile ranges.

Distribution of MYC copy numbers in tumor and adjacent nontumor tissues from 129 patients. The Mann-Whitney U test was performed to examine group differences. Vertical bars indicate median and interquartile ranges.