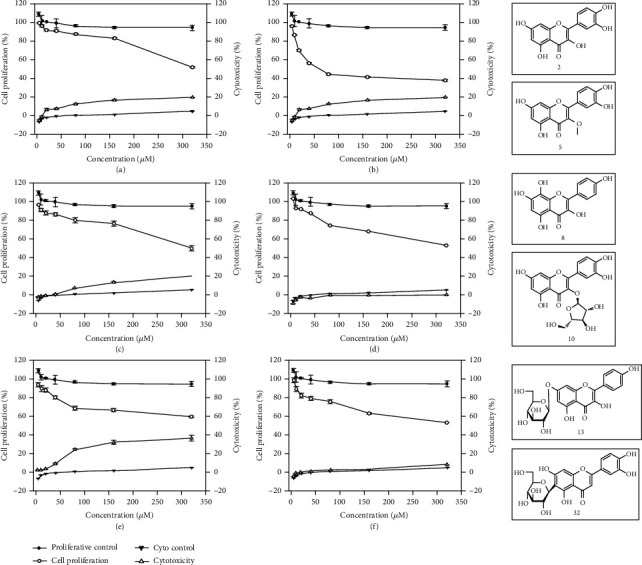
Figure 4.

The antiproliferative activities, cytotoxicities, and structures of compounds 2 (a), 5 (b), 8 (c), 10 (d), 13 (e), and 32 (f) against HepG2 cells. The data are presented as the mean with standard deviation (SD) bar of three replicates. Bars with no letters in common were significantly different (P < 0.05).
