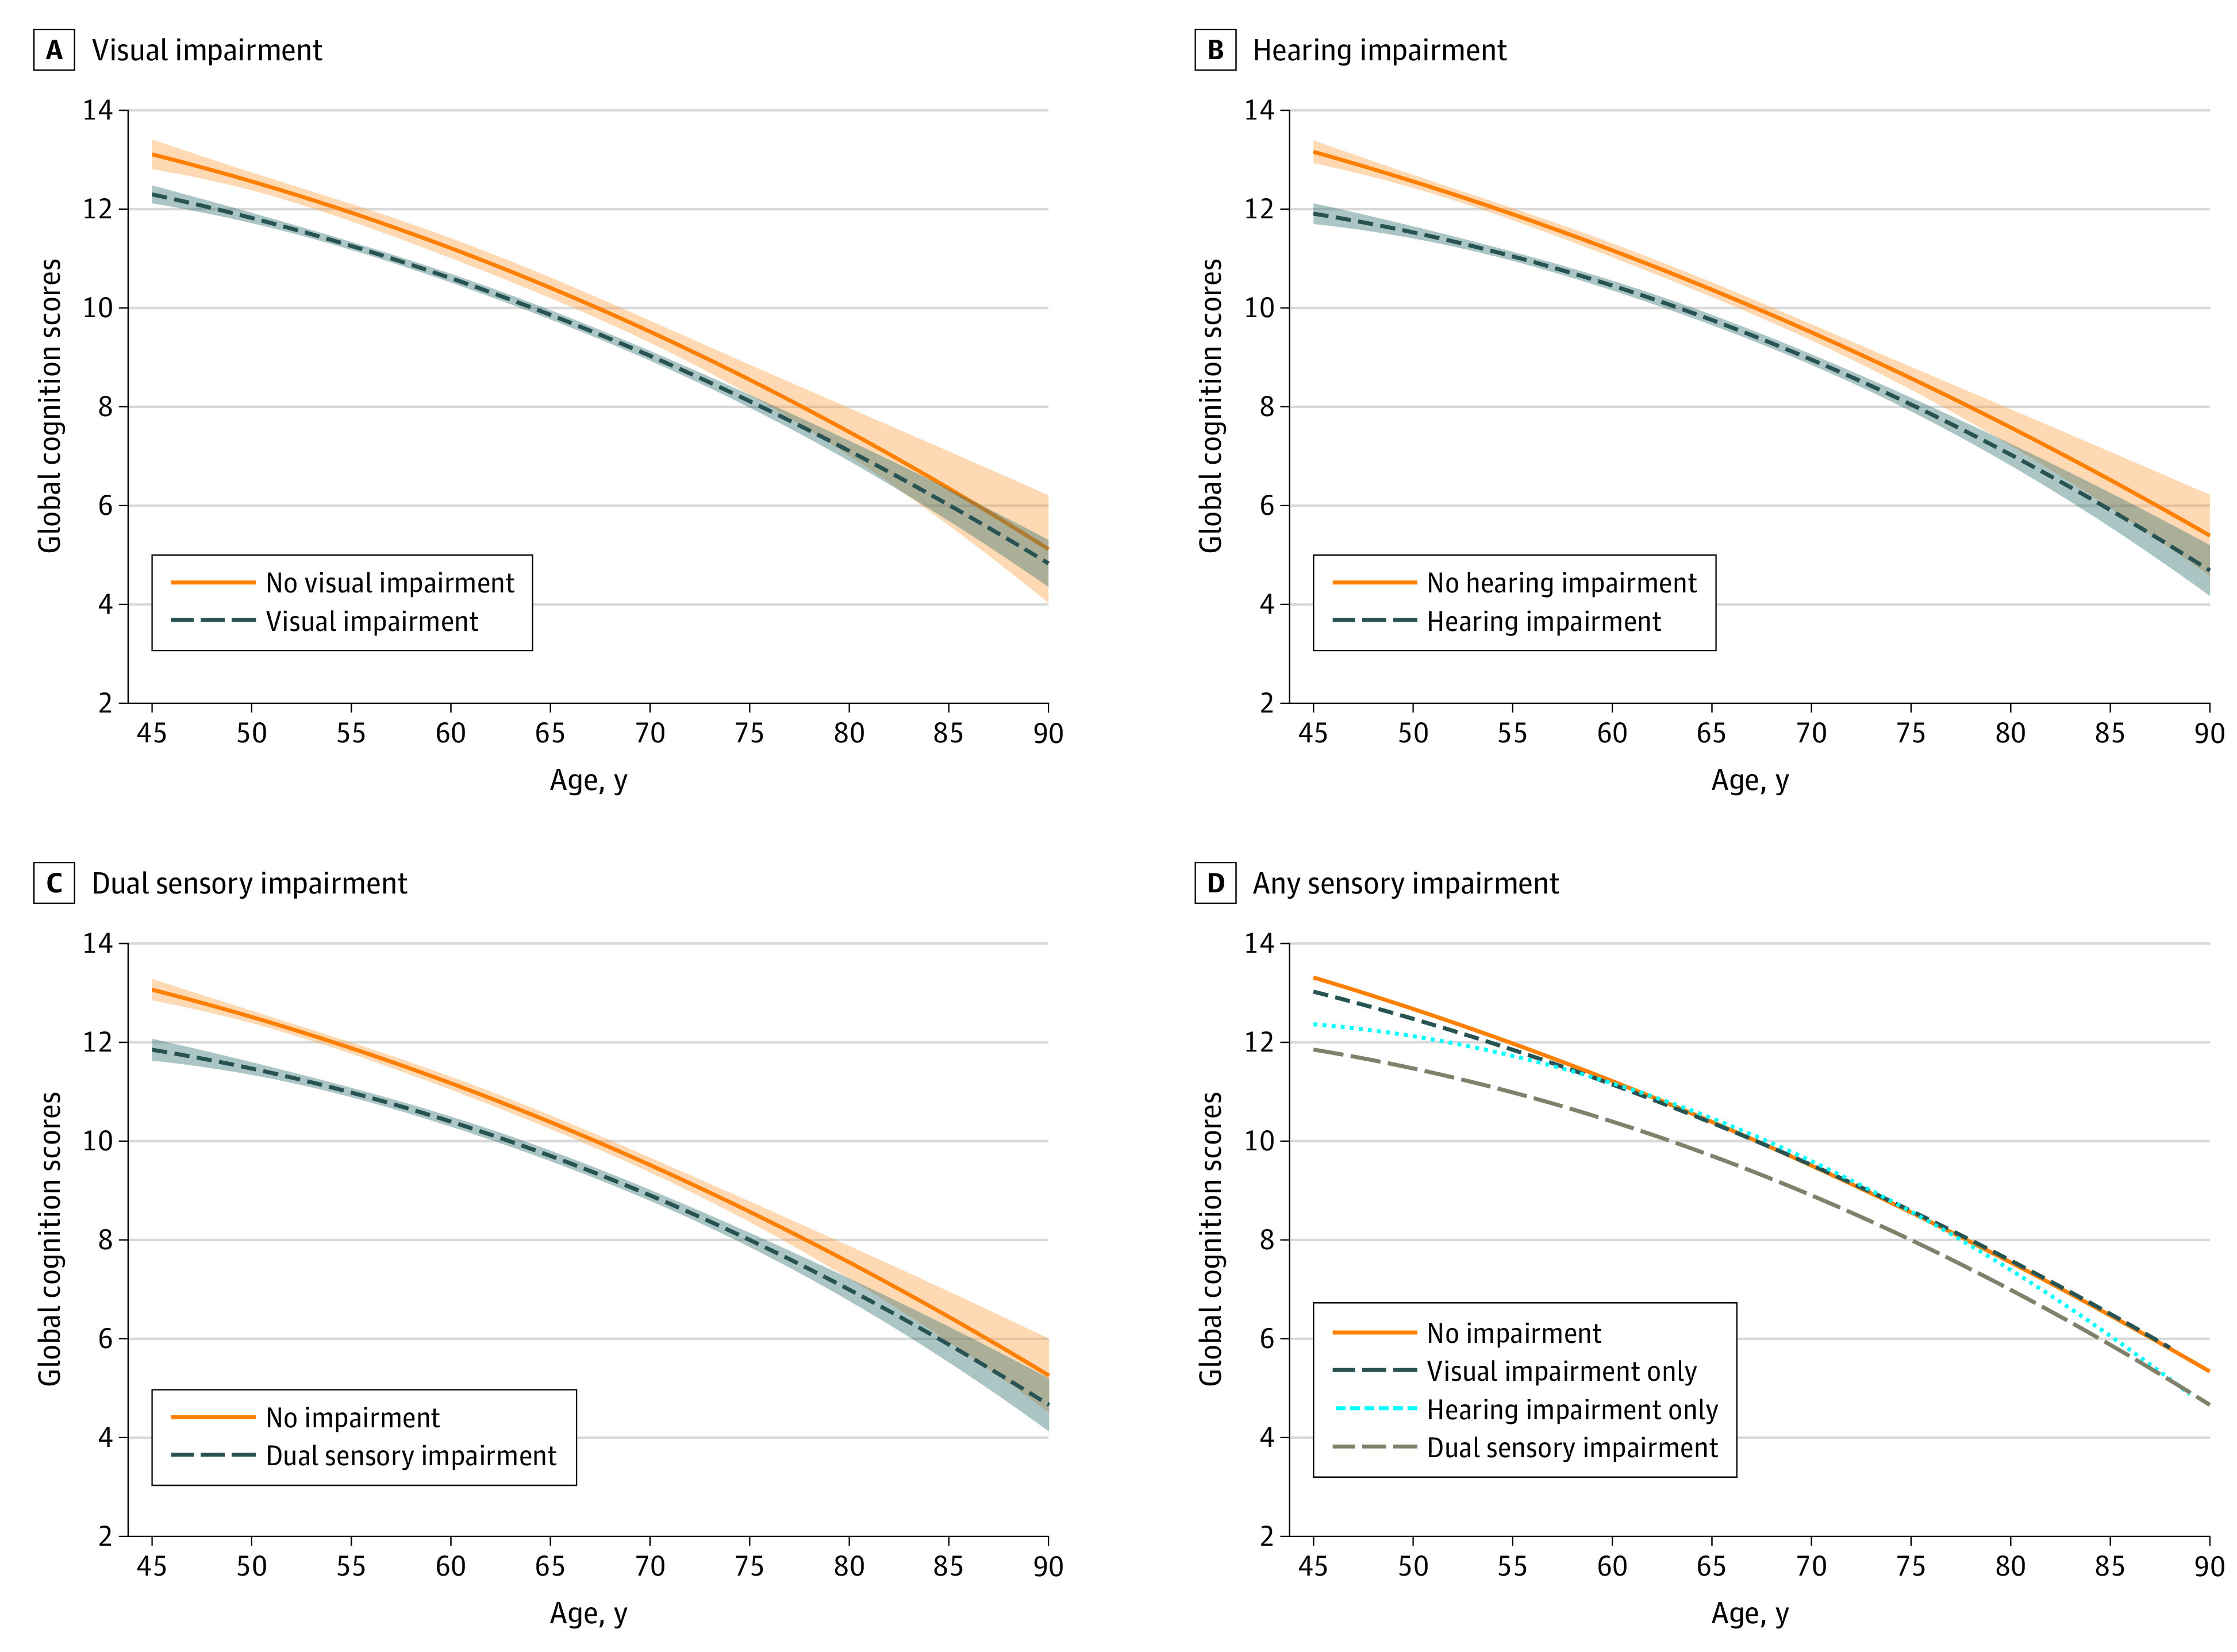
Figure 3. Trajectories of Cognition Scores by the Presence of Sensory Impairments in the 2015 China Health and Retirement Longitudinal Study.

Graphs display analog values (lines) of the global cognition score with 95% CIs (shaded areas) for visual impairment (A), hearing impairment (B), dual sensory impairment (C), and any sensory impairment (analog values only) (D).
