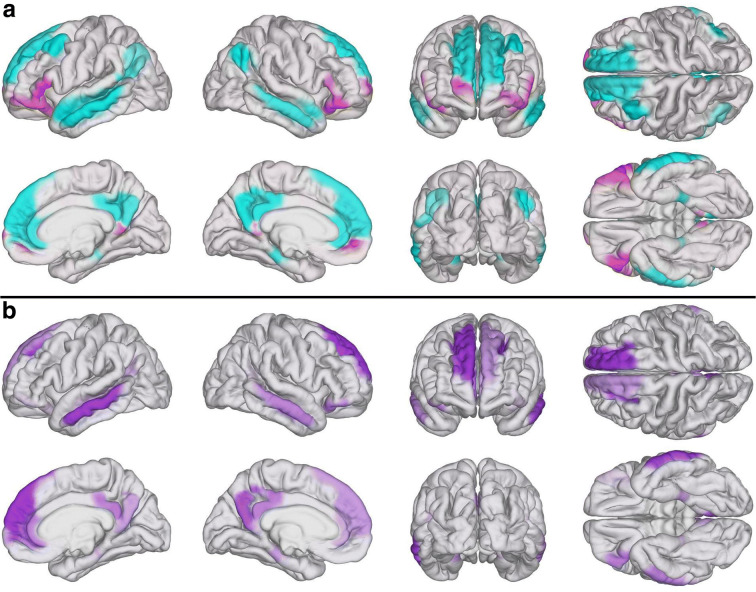
Fig. 4.
Cortical maps of DMN modules. (A) Mα (magenta) and Mβ (cyan) mapped on the surface of an average brain atlas. (B) TBI-affected brain regions in S(TBI, AD) (see Fig. 3) whose chronic similarity to AD was predicted based on acute cognitive scores using SVMs

