Fig. 2.
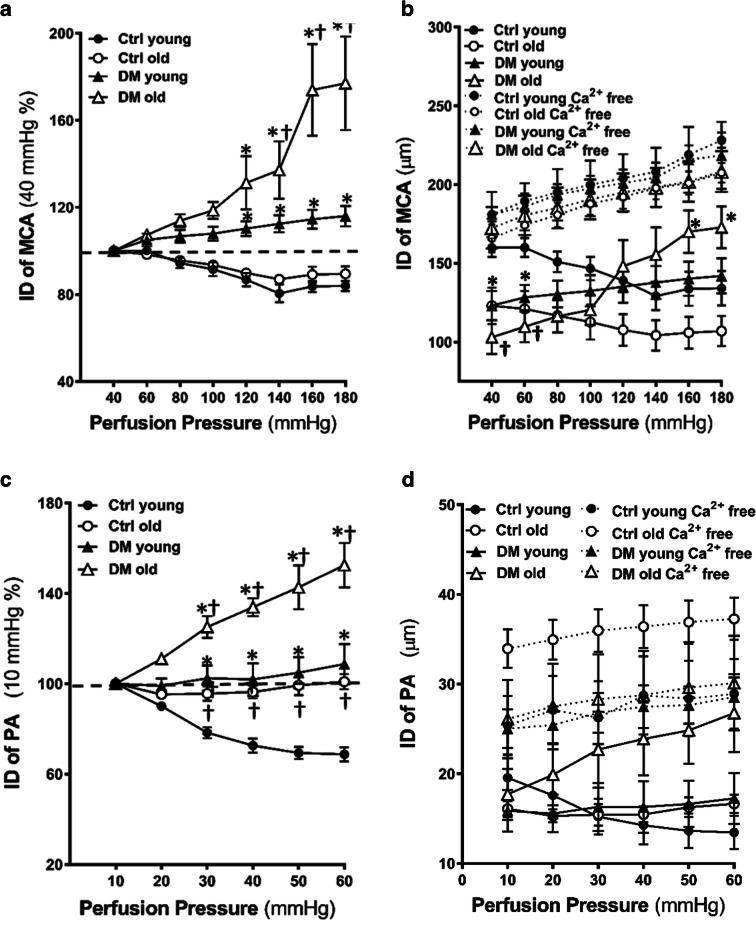
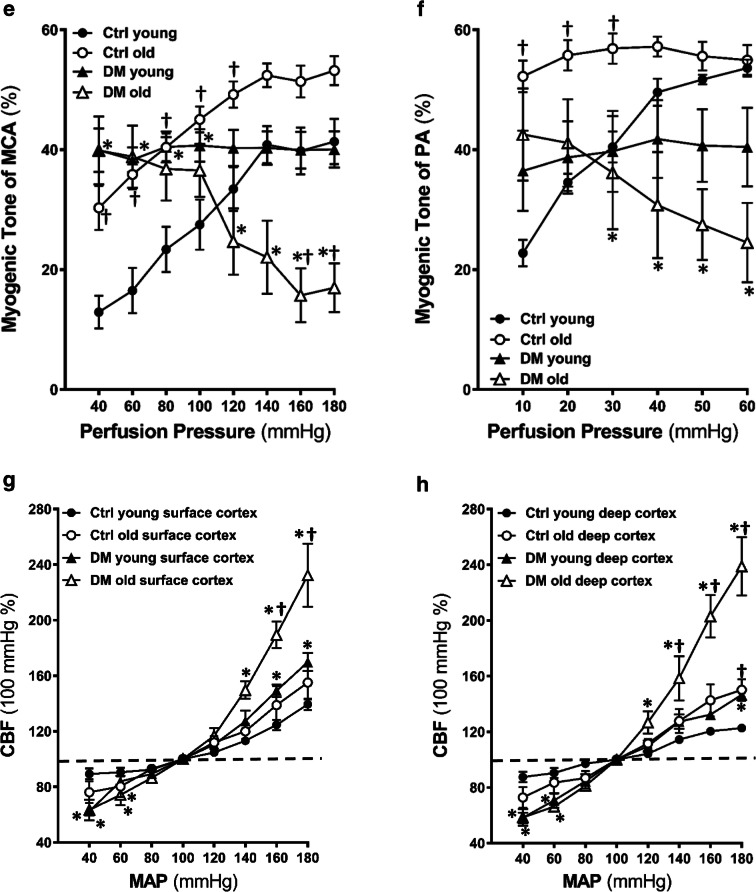
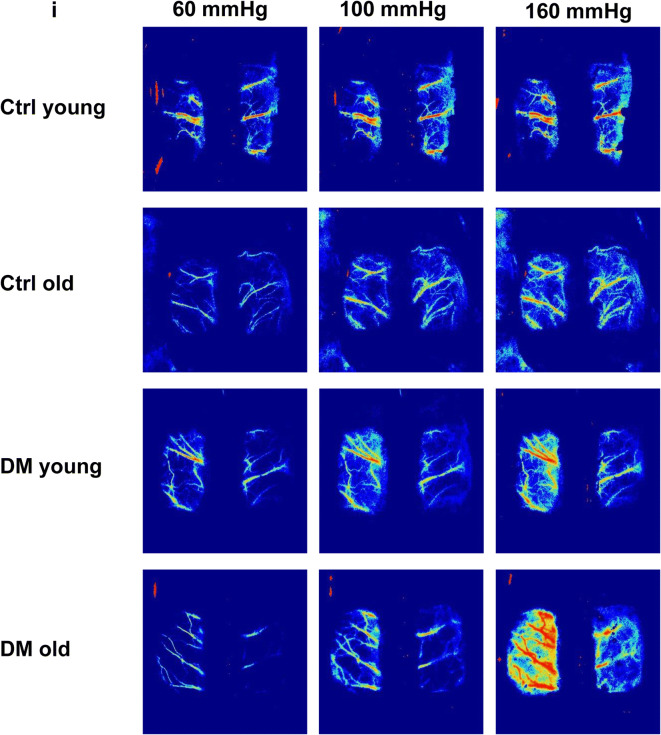
Myogenic response, myogenic tone, and autoregulation of CBF. Comparison of the myogenic response, myogenic tone of the MCA and PA, and surface and deep cortical CBF autoregulation in young and old non-diabetic control (Ctrl) and DM rats. a Comparison of the myogenic response of the MCA as of % constriction to 40 mmHg. b Absolute values of IDs of the MCA in PSS and PSS0Ca solutions. c Comparison of the myogenic response of the PA as of % constriction to 10 mmHg. d Absolute values of IDs of the PA in PSS and PSS0Ca solutions. e Comparison of the % of the myogenic tone of the MCA. f Comparison of the % of the myogenic tone of the PA. g Comparison of surface cortical CBF autoregulation as of % to 100 mmHg. h Comparison of deep cortical CBF autoregulation as of % to 100 mmHg. i Representative laser speckle contrast images of surface cortical CBF at 60, 100, and 160 mmHg. Mean values ± SEM are presented. N = 4–9 rats per group. The asterisk indicates P < 0.05 from the corresponding values in age-matched SD rats. The dagger indicates P < 0.05 from the corresponding values in young rats within a strain


