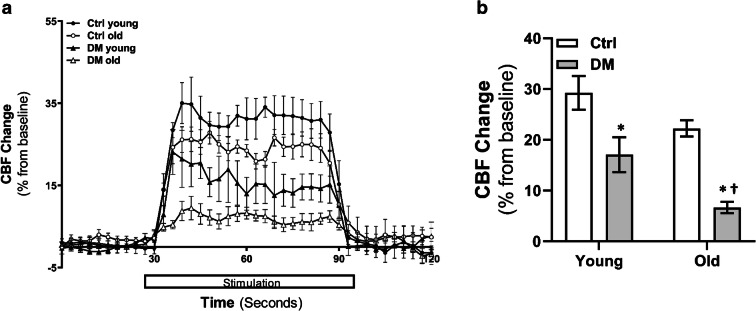
Fig. 4.
Functional hyperemia. Comparison of CBF response to whisker stimulation in young and old non-diabetic control (Ctrl) and DM rats. a Time course of percentage changes of cortical CBF in response to whisker stimulation. b Averaged percentage changes in CBF during 60 s of stimulation. Mean values ± SEM are presented. N = 4 rats per group. The asterisk indicates P < 0.05 from the corresponding values in age-matched SD rats. The dagger indicates P < 0.05 from the corresponding values in young rats within a strain

