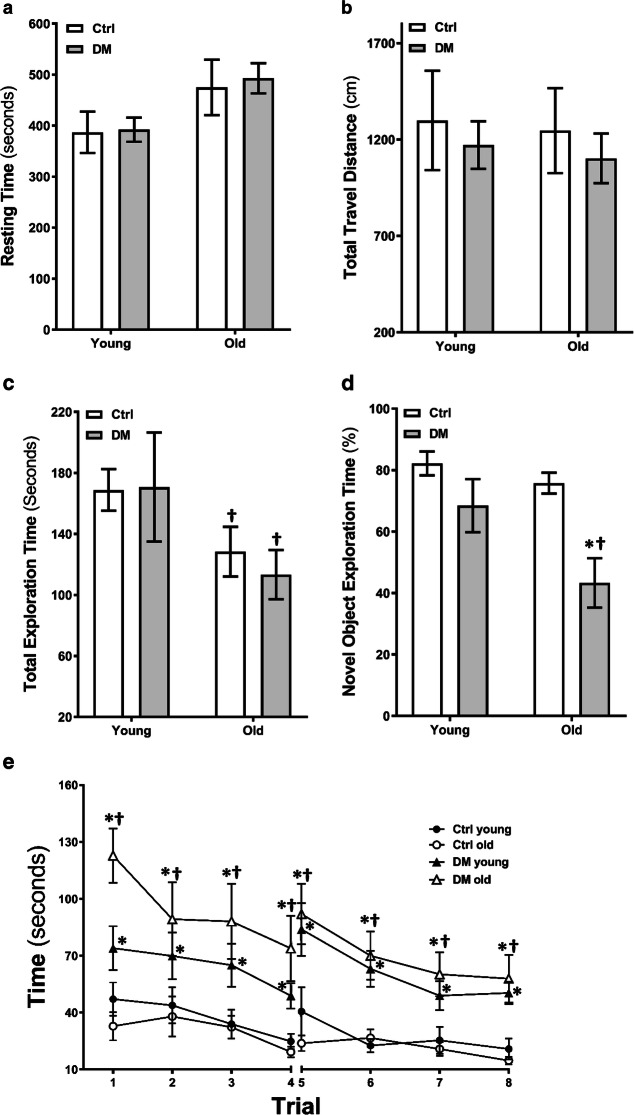
Fig. 7.
Neurobehavioral tests. Resting time (a) and total travel distance (b) in the open field test in young and old non-diabetic control (Ctrl) and DM rats. N = 6–11 rats per group. Total exploration time (c) and percentage time spent in the vicinity of the novel object (d) in the novel object recognition test. N = 6–11 rats per group. Time to reach the platform per trial in a 2-day eight-arm water maze test (e). N = 9–19 rats per group. Mean values ± SEM are presented. The asterisk indicates P < 0.05 from the corresponding values in age-matched SD rats. The dagger indicates P < 0.05 from the corresponding values in young rats within a strain

