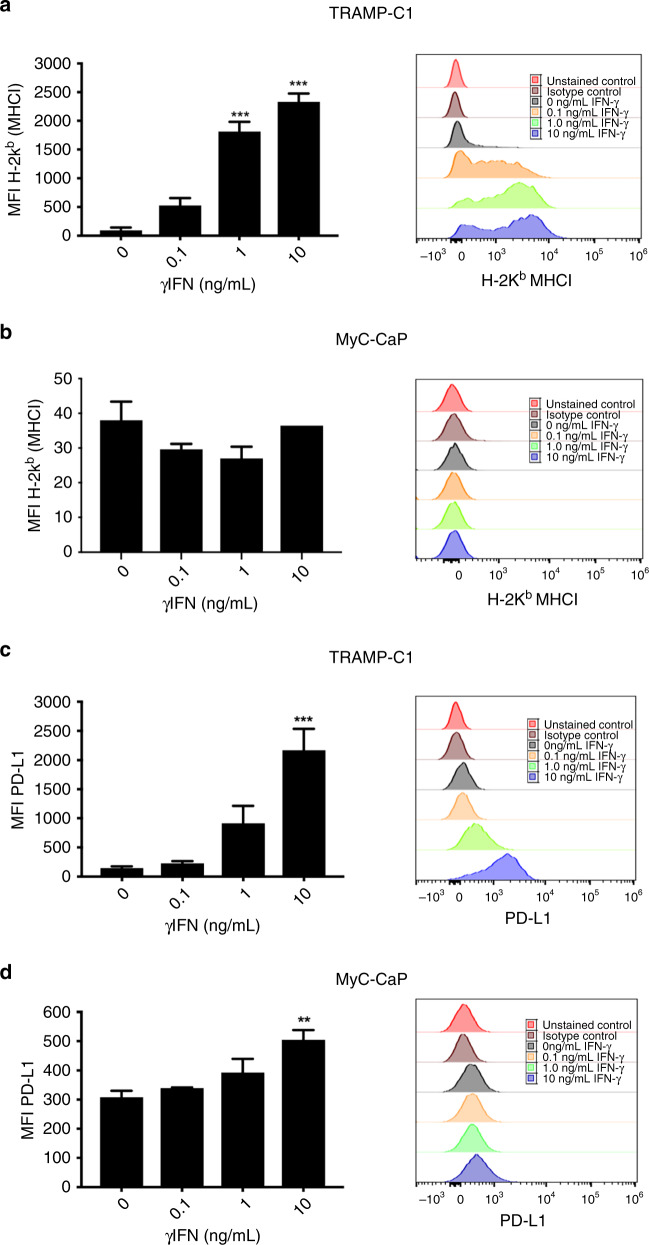
Fig. 1. FACS analysis of MHC Class I and PD-L1 expression following in vitro treatment of TRAMP-C1 and MyC-CaP cells with γIFN.
Increased expression of MHC Class I on FACS was observed in TRAMP-C1 (a) following 1 ng/mL and 10 ng/mL γIFN but not MyC-CaP (b) cells at 72 h. Increased expression of PD-L1 following in vitro treatment with 10 ng/mL γIFN was seen in both cell lines (c, d) at 72 h, with the degree of PD-L1 upregulation in response to γIFN being greater in TRAMP-C1 than in MyC-CaP cells. Data are presented as mean fluorescent intensity (MFI) ± SEM, and analysed using ordinary one-way ANOVA with Dunnett’s post hoc adjustment for multiple comparisons (n = 3 independent experiments). **p < 0.01; ***p < 0.001.

