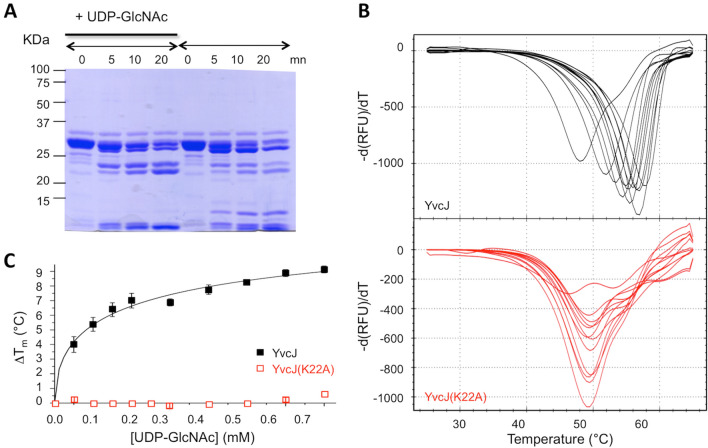
Figure 5.
Investigation of the potential binding of UDP-GlcNAc to YvcJ by partial proteolysis and Thermal Shift Assay (TSA). (A) Coomassie-stained SDS-PAGE of YvcJ partial proteolysis profile. YvcJ was incubated with endoproteinase Glu-C (Promega) in the presence or in the absence of 1 mM UDP-GlcNAc for 0, 5, 10 or 20 min at 37 °C. The digestion profiles were assessed by electrophoresis in 12.5% SDS-PAGE. Full-length gel is presented in Fig. S8. (B) TSA in the presence of increasing concentrations of UDP-GlcNAc. YvcJ (top) and YvcJ(K22A) (bottom) melting profiles were monitored in the presence of increasing concentration of UDP-GlcNAc (0–1 mM). One curve corresponds to data obtained for one concentration of UDP-GlcNAc. The melting temperature of the protein (Tm) is obtained at the midpoint of each melting curve and corresponds to the minimum of the negative derivative curves. The Tm is an indicator of protein stability and is increased by the addition of UDP-GlcNAc. For the WT protein, Tm = 48 °C in the absence of UDP-GlcNAc and Tm = 58.5 °C in the presence of 1 mM UDP-GlcNAc. For YvcJ(K22A), Tm = 49.5 °C and is not increased by addition of UDP-GlcNAc. (C) TSA results for the binding of UDP-GlcNAc to YvcJ. Assays were performed with YvcJ and YvcJ(K22A) in the presence of increasing concentrations of ligands (0–0.7 mM). The difference of temperature (the shift of Tm induced by the presence of ligand) was plotted against the concentration of UDP-GlcNAc. Each experiment was reproduced at least in triplicate and the standard deviations are represented by the error bars. Curve fitting was performed by using Microcal Origin 5.0 software (Microcal software Inc).

