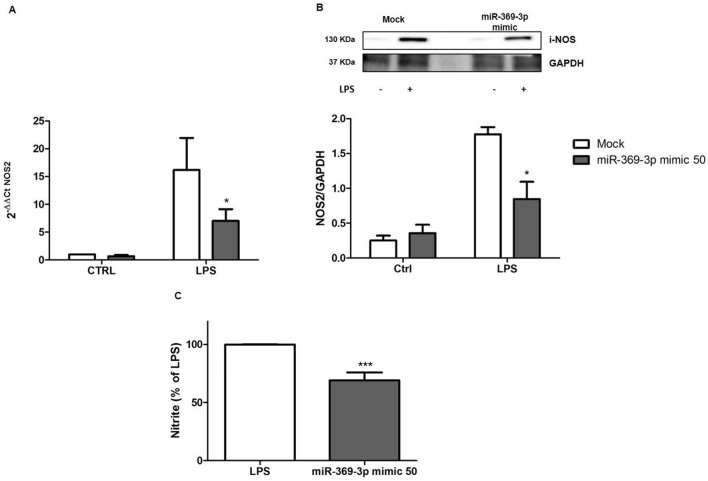
Figure 2.
miR-369-3p regulates iNOS mRNA and protein expression and LPS-induced NO production. (A) The mRNA expression levels of iNOS were evaluated by qRT-PCR in LPS-stimulated BMDCs transfected with 50 nM of miR-369-3p mimic. The ectopic increase of endogenous miR-369-3p in LPS-stimulated BMDCs led to a significant decrease of iNOS (2.3-fold decrease). (B) Expression analysis of iNOS protein after miR-369-3p mimic transfection using Western blot analysis. A significant decrease in iNOS protein production was shown after transfection. “Mock” indicates mock-transfected cells going through the transfection processes without the addition of mimic miRNA. The housekeeping gene was used to normalize expression data. Ratio was calculated by dividing the normalized values of stimulated and/or transfected cells by the values of normalized control cells. Data are representative of four independent experiments. The histograms represent the mean ± SEM. *p < 0.05 compared to the same treatment in the mock condition. The presented blots were cropped. Full-length blots are shown in Supplementary Fig. S1. (C) miR-369-3p induction reduces NO production. LPS-stimulated BMDCs after miR-369-3p mimic transfection showed a significant reduction of NO production. Nitrite was measured in the culture supernatants using Griess reagent and expressed as a percentage of the LPS group. *p < 0.05 compared to LPS group.

