Figure 6.
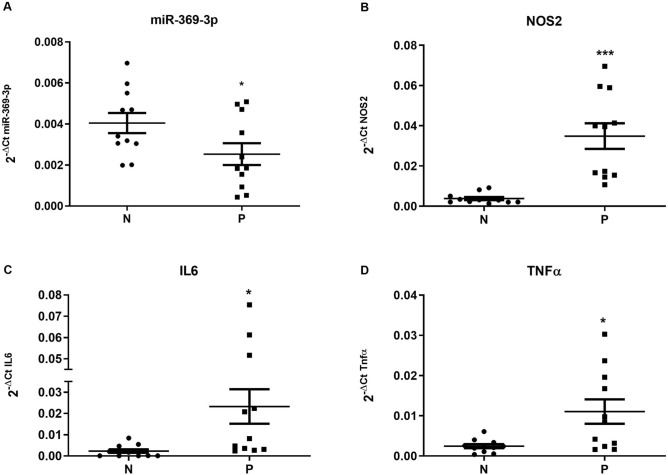
miR-369-3p, NOS2, IL6 and TNFα expression levels in non-inflamed and inflamed regions of intestine from IBD patients. Total RNA samples isolated from non-inflamed (N) and inflamed (P) regions of intestine were obtained from 11 IBD patients and were analyzed for miR-369-3p (A), NOS2 (B), IL6 (C) and TNFα (D) by qRT-PCR. miR-369-3p in the inflamed areas was significantly lower than those in non-inflamed tissue. Expression data of miR-369-3p were normalized to the endogenous control miR-26a-5p. NOS2, IL6 and TNFα expression levels were normalized to the housekeeping gene Gapdh. The dot-plot graphs represent the mean ± SEM. *p < 0.05; ***p < 0.0001.

