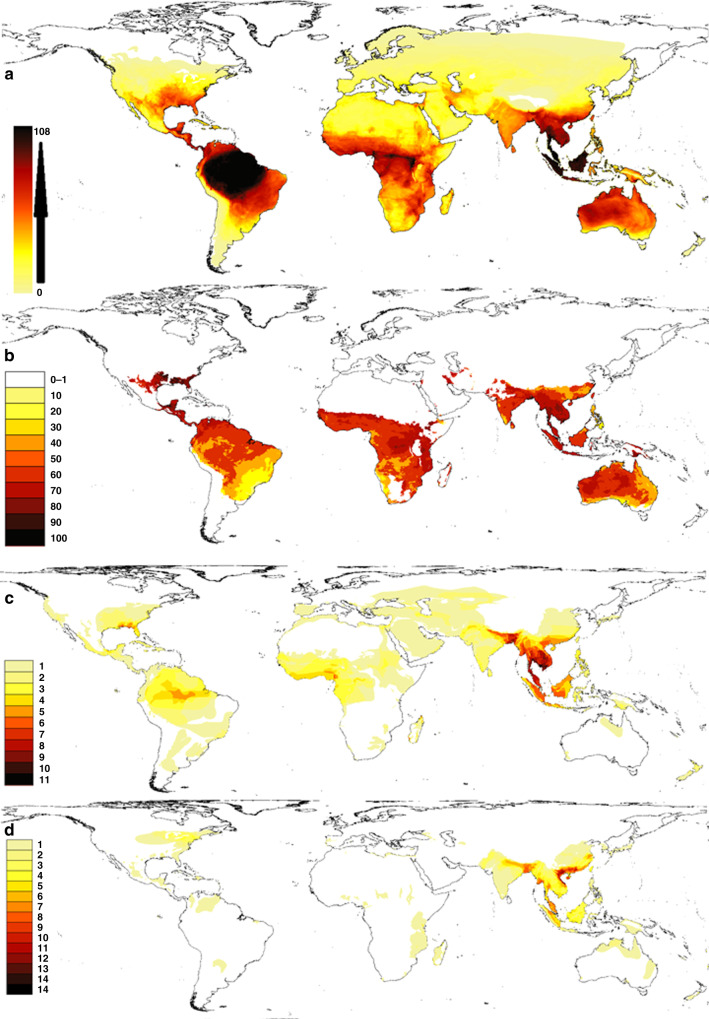
Fig. 3. Maps showing the species distributions of all traded reptile species based on species listed in trade in the three data sources (Online, LEMIS and CITES).
Reptile range maps of traded species are from the GARD database. a Number of traded species from any given location. Supplementary Fig. 5 shows the number of species listed in trade in each of the three sources separately. b Percentage of species in trade where over 50 species exist. Yellow colours indicate under 50% and red-black over 50% (areas with low diversity may have a high percentage of species in trade based on low numbers of species in total only diverse areas are shown here, whereas Fig. S5 shows percentage of species in trade for all species richness levels). c Origin of traded species listed as Endangered or Critically Endangered by the IUCN showing the number of species with that status in any given location. d Origin of traded species listed as Vulnerable by the IUCN and the number of Vulnerable species.

