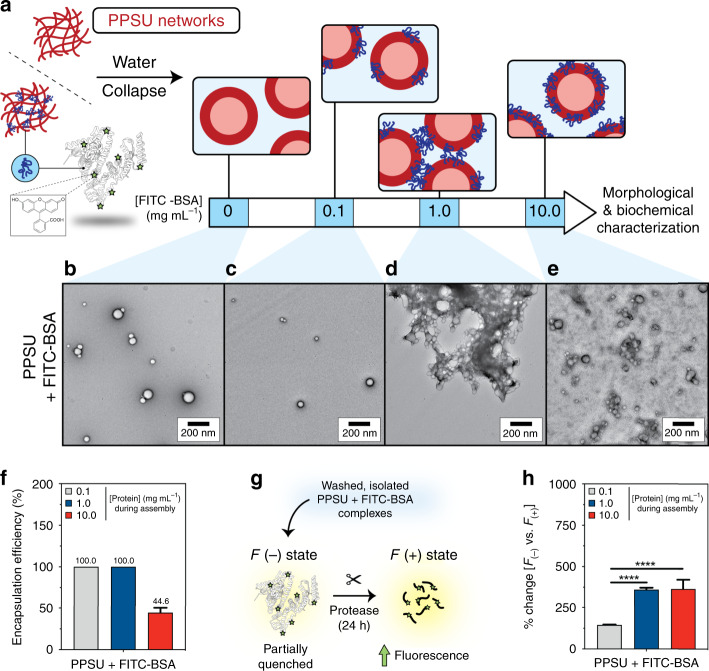
Fig. 4. Encapsulation of protein in PPSU nanogels.
a PPSU20 nanostructures (5 mg) were assembled with a concentration series of aqueous FITC-BSA at 0.1, 1.0, or 10 mg mL−1 (1.6, 16, and 160% w/w protein/PPSU). PPSU20 nanostructures prepared without protein (0 mg mL−1 FITC-BSA) were included as a control. b–e Transmission electron microscopy of negatively stained specimens. b PPSU20 nanostructures absent of protein. PPSU-FITC-BSA complexes assembled in the presence of (c) 0.1, (d) 1.0, or (e) 10.0 mg mL−1 FITC-BSA (purposefully overloaded sample and the free FITC-BSA was not removed). Scale bar = 200 nm. f Encapsulation efficiency of FITC-BSA protein cargo. g Trypsin proteolysis assay illustration. In the absence of protease, FITC-BSA is partially quenched and exhibits weak fluorescence. After trypsin treatment, FITC-labeled peptides are released and the fluorescence of the FITC fluorophore increases. h The percentage increase in FITC fluorescence (i.e., 100 × (F(+) − F(−))/F(−)) after trypsin proteolysis was calculated, where F(+) is the fluorescence after protease treatment and F(−) refers to the fluorescence in the absence of protease treatment. Increased FITC fluorescence is a readout of whether embedded protein interfaces with the external aqueous environment. Error bars represent the standard deviation from three parallel experiments. Statistical significance was determined by Tukey’s multiple comparisons test. ****p < 0.0001.

