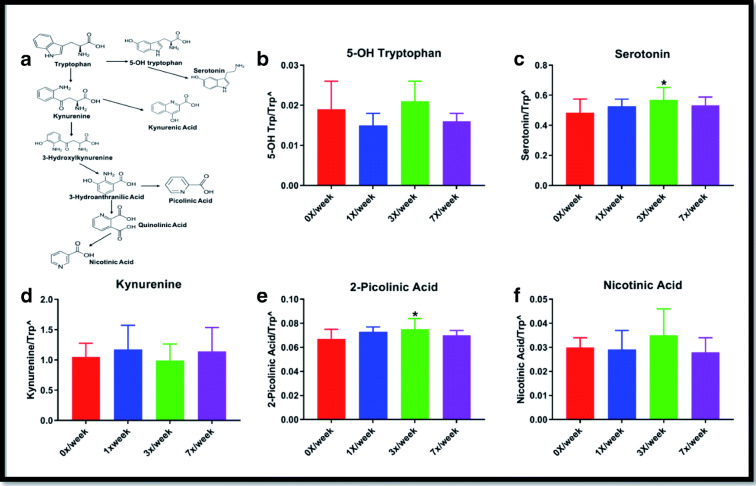
Fig. 4.
Serum concentrations of downstream metabolites of tryptophan metabolism genes following 29 days of oral Ang(1–7) expressing Lactobacillus paracasei delivery. (A) Simplified schematic of serotonin and kynurenine pathways of tryptophan metabolism and (B) serum 5-OH tryptophan, (C) serotonin, (D) kynurenine, (E) 2-picolinic acid, and (F) nicotinic acid. Carets indicate data expressed as metabolite concentration (mean ± SD) relative to total tryptophan normalized via the square root function (due to non-normally distribution of raw data). Asterisks indicate a significant difference from the 0×/week condition

