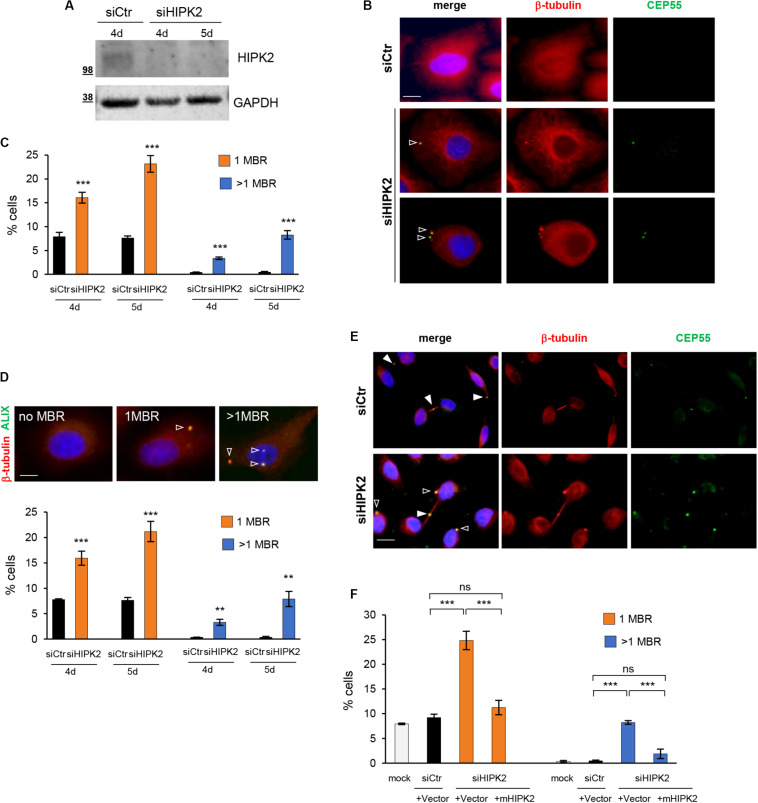
FIGURE 1.
MBR in HIPK2-depleted cells. (A–D) HeLa cells were transfected with HIPK2 -specific siRNA or negative universal control and analyzed 4 and 5 days posttransfection by WB with indicated Abs to verify RNAi and by IF for MBR quantification by using CEP55 as MBR marker in combination with β-tubulin costaining. DAPI (blue) was used to stain DNA. Representative WB and images are shown in (A,B), respectively. Scale bar, 5 μM. Here, and in the following images, the empty arrowheads indicate MBR. The percentage of cells with 1 or >1 MBR were reported as mean ± standard deviation (SD) in (C) from three independent experiments, in which at least total 3,000 cells per condition were analyzed. ***p < 0.001 and **p < 0.01, unpaired t test. (D) HeLa cells were transfected as in (A), analyzed by IF by using ALIX as MBR marker in combination with β-tubulin costaining and DAPI to stain DNA. Data reported as in (C), are from three independent experiments, in which at least total 3,000 cells per condition were analyzed. ***p < 0.001, **p < 0.01, unpaired t test. Representative images are shown. Scale bar, 5 μM. (E) Representative images of siCtr and siHIPK2 HeLa cells 5 days posttransfection. CEP55 marks MBR as well as the midbody. Here, and in the following images, the full arrowheads indicate CEP55 at midbody. Scale bar, 10 μM. (F) HeLa cells 36 h upon transfection with low doses of vectors expressing GFP-tagged murine HIPK2-WT or GFP empty vector and analyzed by IF as in (C). Data are reported as mean ± SD from three independent experiments, in which a total of 2,000 cells per condition were analyzed. Note that the expression of murine HIPK2 protein is not silenced by RNAi because human-specific siRNAs were used in siHIPK2 cells. ***p < 0.001, ns = not significant, unpaired t test.

