. 2020 Sep 7;9:e54542. doi: 10.7554/eLife.54542

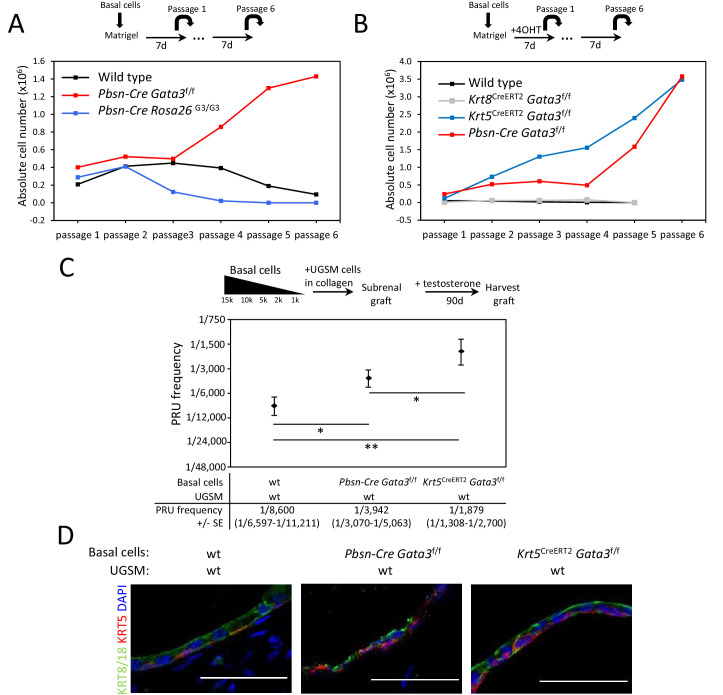
Figure 1. Gata3 loss leads to an expansion of prostate basal stem/progenitor cells numbers.

(A) Effect of Gata3 loss and overexpression on in vitro basal stem/progenitor maintenance potential. Organoid-forming potential was assessed by plating equal numbers (105 cells) of sorted basal prostate cells from the indicated genotypes in Matrigel and passaged every 7 days. Shown is the absolute number of cells obtained after each passage for the indicated genotypes. Data are representative of two independent experiments from a pool of prostate cells from a minimum of three mice. (B) Specific deletion of Gata3 in KRT5+ basal cells affect the organoid-forming potential upon passage. Organoid-forming potential was assessed as in (A). Cre activity was induced in vitro by treatment with hydroxy-tamoxifen for the first passage. (C) Gata3 loss increase regenerative capacity in vivo. Different numbers of sorted basal cells from wild type (Pbsn-Cre, Pbsn-Cre Gata3f/f and Krt5CreERT2Gata3f/f) prostate were mixed with UGSM and transplanted under the kidney capsule of immunodeficient mice. All mice contain Rosa26LstopLTdTomato/+ allele and Cre activity was induced in vivo by tamoxifen injection in adult mice 4 weeks prior to organoid propagation potential assessment. Prostate reconstituting units (PRU) frequency of total basal cells was calculated based on growth of TdTomato+ grafts using the Limiting Dilution Analysis software L-Calc (StemCell Technologies) according to Poisson statistics (two-tailed t-test; *p<0.05, **p<0.001). (D) Immunofluorescence staining of lineage-specific markers KRT5 (basal) and KRT8/18 (luminal) in wild type, Pbsn-Cre Gata3f/f and Krt5CreERT2Gata3f/f allografts. Scale bar is representative of 50 μm. See also Figure 1—figure supplements 12.

Figure 1—source data 1. Statistical analysis for Figure 1A–B and Figure 1—figure supplement 2A–B.
Figure 1—source data 2. Statistical analysis for Figure 1C.

Figure 1.

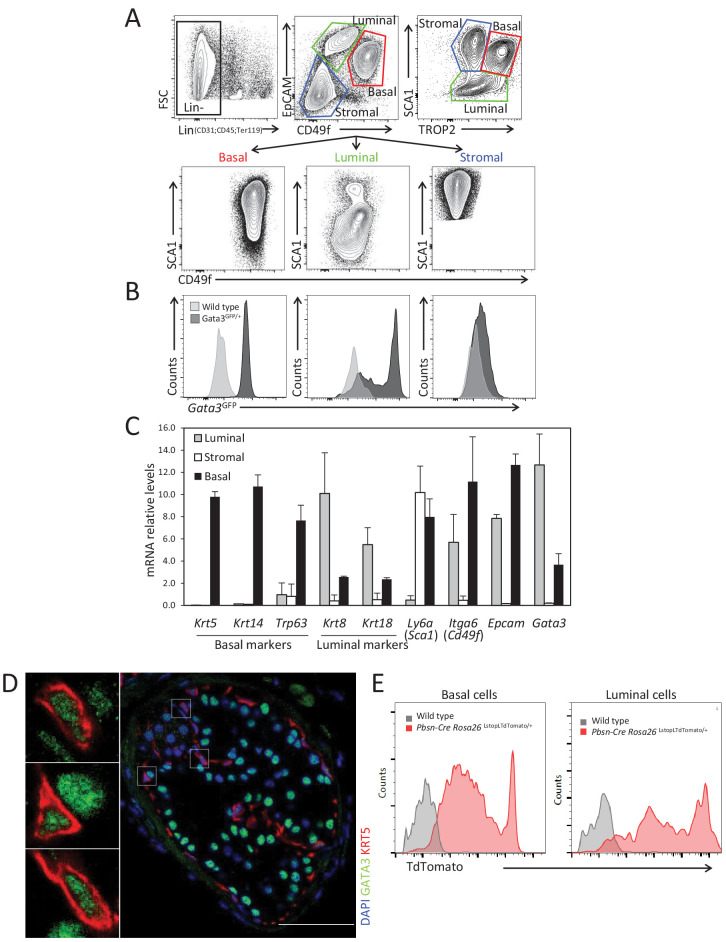
Figure 1—figure supplement 1. GATA3 is expressed in prostate basal and luminal cells.

Figure 1—figure supplement 1.

(A) Representative fluorescence-activated cell sorting (FACS) strategy to purify stromal, luminal and basal cell populations from adult prostate using antibodies against surface markers: CD45, CD31, TER119, CD49f, EpCAM, SCA1, and TROP2. (B) Histogram of endogenous Gata3-driven GFP reporter expression in the indicated populations in Gata3GFP knock-in and wild-type mice. (C) Expression of specific population markers in FACS sorted stromal, luminal and basal cell populations from adult prostate as assessed by quantitative RT-PCR. Relative mRNA expression levels are normalized to Ppia mRNA levels (Average ± SD, n = 3). (D) Immunofluorescence analysis of GATA3 in prostate tissue from adult wild-type mice. Notice the expression of GATA3 in both basal and luminal cells. Scale bar: 50 μm. (E) Specific activation of Rosa26LstopLTdTomato fluorescent reporter by Pbsn-Cre transgene in basal and luminal populations from adult prostate tissue as assessed by FACS.
Figure 1—figure supplement 1—source data 1. Expression levels of differentially expressed genes between populations on Figure 1—figure supplement 1C.
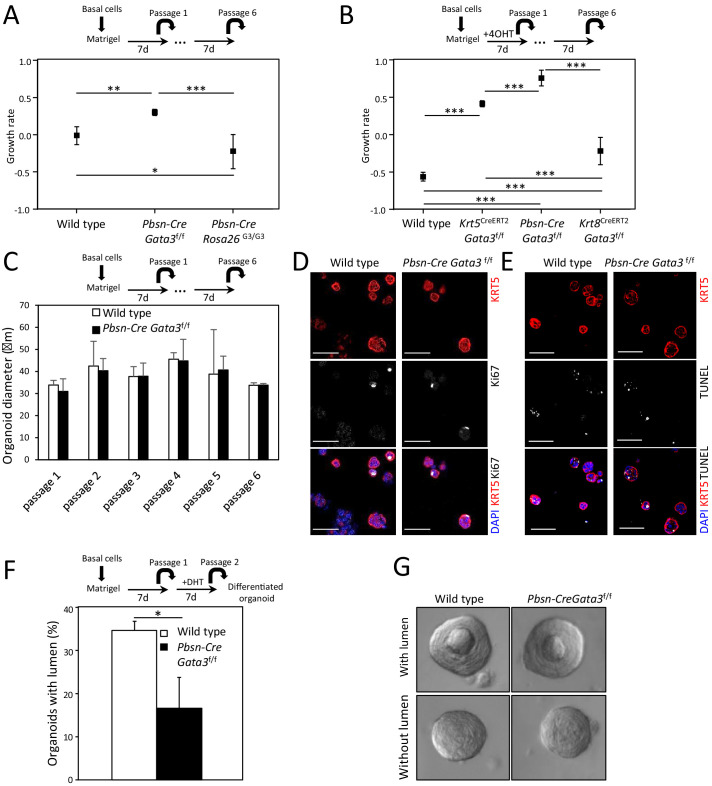
Figure 1—figure supplement 2. Gata3 is important for propagation and differentiation of organoids.

Figure 1—figure supplement 2.

(A–B) Growth rate of cells upon organoid passage for the indicated genotypes calculated from nonlinear regression curve fit of data from Figure 1A and B, respectively (one-way ANOVA; *p<0.02, **p<0.002, ***p<0.0001). (C) Loss of Gata3 does not affect organoid size over several passages. Shown is the average diameter of wild type and Pbsn-Cre Gata3f/f organoids (Average ± SD). (D–E) Loss of Gata3 in organoids does not affect proliferation or survival. Immunofluorescence staining for KRT5 and Ki67 (D) and TUNEL reaction (E) was done on 4-day-old organoids at passage 2. (F–G) Gata3 loss reduces cell differentiation potential. Organoids from wild type and Pbsn-Cre Gata3f/f grown for 7 days were passaged and differentiated by dihydrotestosterone (DHT) treatment. The average percentage of organoids which form lumen (F) and representative images of organoids with and without lumen (G) for the indicated genotypes (average ± SD, n = 117, two-tailed t-test as compared to wild-type condition; *p<0.0001).
Figure 1—figure supplement 2—source data 1. Statistical analysis for Figure 1—figure supplement 2F.
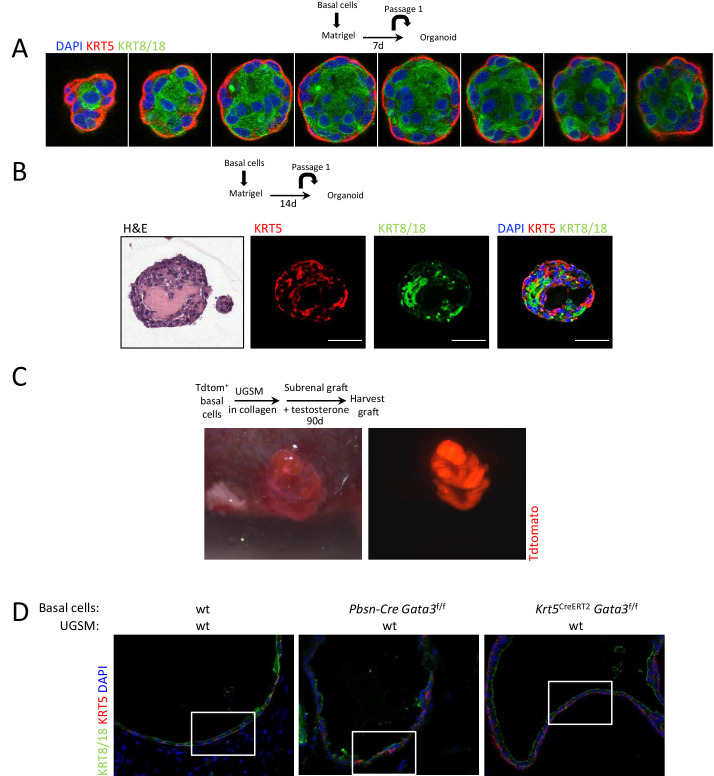
Figure 1—figure supplement 3. Ductal structures with multiple alveoli and a lumenized epithelial structure in allografts and organoids.

Figure 1—figure supplement 3.

(A–B) KRT5 (basal cells) and KRT8/18 (luminal cell) expression in day 7 (A) and day 14 (B) wild-type prostate organoids. Shown is the H&E staining of a day 14 organoid. (C) TdTomato+ allograft. Purified Lin-SCA1+CD49f+EpCAM+TROP2+ basal prostate cells from Pbsn-Cre Rosa26TdTomato mice were mixed with urogenital sinus mesenchyme cells (UGSM) and transplanted under the kidney capsule of immunodeficient mice. Shown is the brightfield (left) as well as the fluorescent (right) picture of the allograft tissue after 90 days. (D) Immunofluorescence analysis of lineage specific markers KRT5 and KRT8/18 in wild type, Pbsn-Cre Gata3f/f and Krt5CreERT2Gata3f/f allografts. Lower magnification pictures of allograft from Figure 1D.