. 2020 Sep 7;9:e54542. doi: 10.7554/eLife.54542

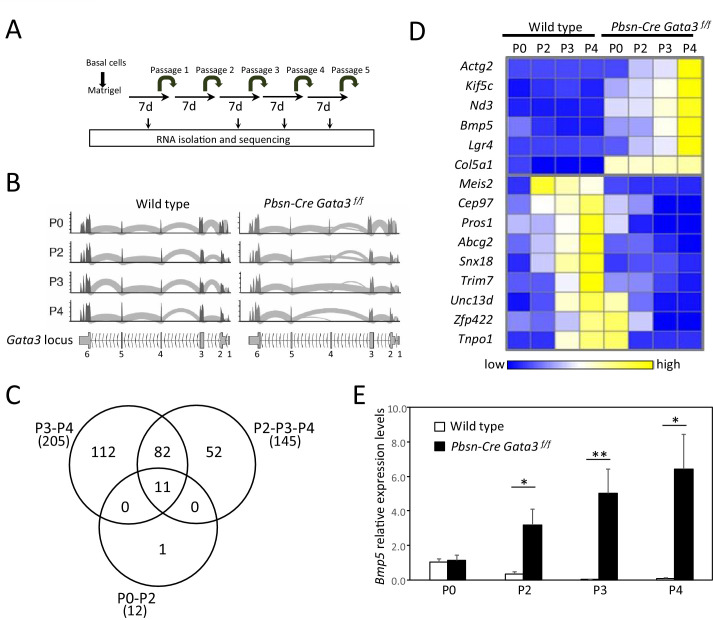
Figure 2. Bmp5 expression in organoids is regulated by Gata3.

(A) Schematic of RNA-seq strategy. mRNA was isolated from 4 days old wild type and Pbsn-Cre Gata3f/f organoids at passages P0, P2, P3 and P4. (B) Deletion of exon four in Pbsn-Cre Gata3f/f samples increases with passages. Shown are the read counts from RNAseq assigned to the Gata3 locus in samples isolated from wild type and Pbsn-Cre Gata3f/f prostate tissue at passage P0, P2, P3 or P4. (C) Venn diagram of genes differentially expressed between wild type and Pbsn-Cre Gata3f/f prostate organoids using likelihood-ratio test with q-value <0.01. (D) Heatmap of log2 transformed mRNA read counts of differentially expressed genes between wild type and Pbsn-Cre Gata3f/f organoids and whose expression pattern follows Gata3 loss with passages. (E) Bmp5 mRNA expression levels as assessed by quantitative RT-PCR in both wild type and Pbsn-Cre Gata3f/f organoids over passages. Data represent the average ± SD from three independent cDNA obtained from a pool of prostate cells from a minimum of three mice. Relative mRNA expression levels are normalized to Ppia mRNA levels (two-tailed t-test as compared to wild-type condition; *p<0.01, **p<0.005). See also Figure 2—figure supplements 12.

Figure 2—source data 1. Expression levels of differentially expressed genes between wild type and Pbsn-Cre Gata3f/f associated with Figure 2C.
Figure 2—source data 2. Expression value for Figure 2D.
Figure 2—source data 3. Statistical analysis for Figure 2E.

Figure 2.

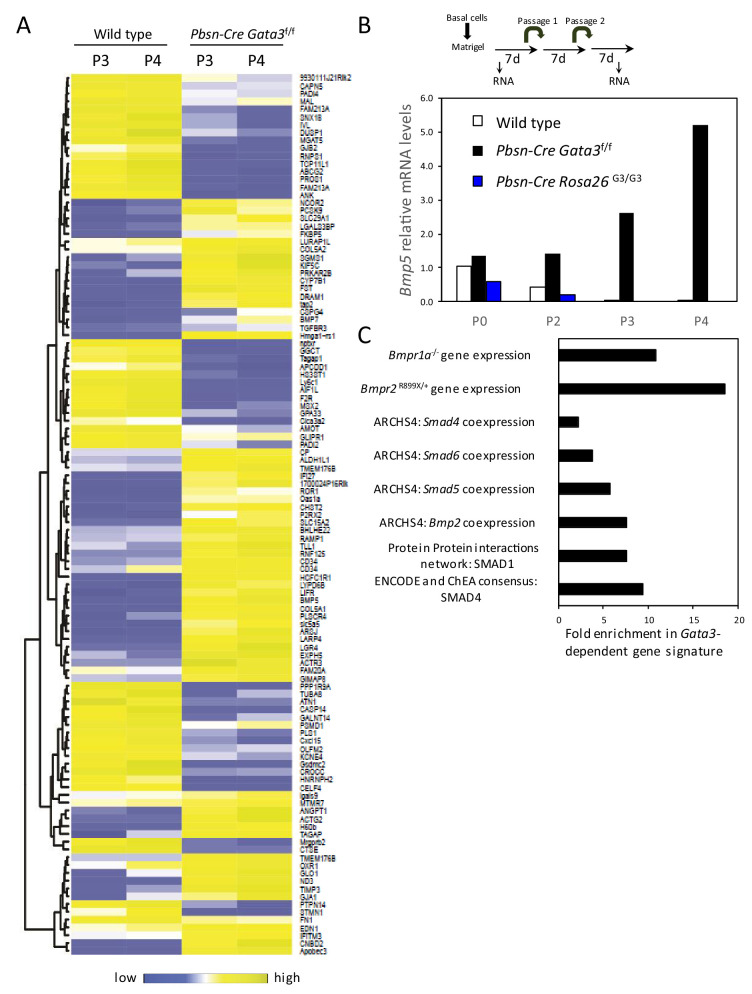
Figure 2—figure supplement 1. Gata3-dependent gene signature.

Figure 2—figure supplement 1.

(A) Heatmap of log2 transformed mRNA read counts of genes differentially expressed between wild type and Pbsn-Cre Gata3f/f organoids at passages 3 and 4 using likelihood-ratio test (q-value <0.01). (B) Overexpression of GATA3 in organoids reduces Bmp5 expression. Shown is the relative expression levels of Bmp5 as assessed by RNAseq from 4-day-old organoids of the indicated passages and genotypes. Data are presented as fold expression over wild-type levels at passage 0. (C) Gata3-dependent gene signature is enriched (A) in genes associated with BMP signaling from different libraries using Enrichr software: targets computed from ENCODE and ChEA project ChIP-seq datasets (ENCODE and ChEA consensus), protein-protein interactions network (PPIs), genes coexpressed with transcription factors (ARCHS4) and genes affected by gene mutation from Gene Expression Omnibus datasets (GEO).
Figure 2—figure supplement 1—source data 1. Expression levels of differentially expressed genes between wild type and Pbsn-Cre Gata3f/f displayed on Figure 2—figure supplement 1A and enrichment analysis from Figure 2—figure supplement 1C.
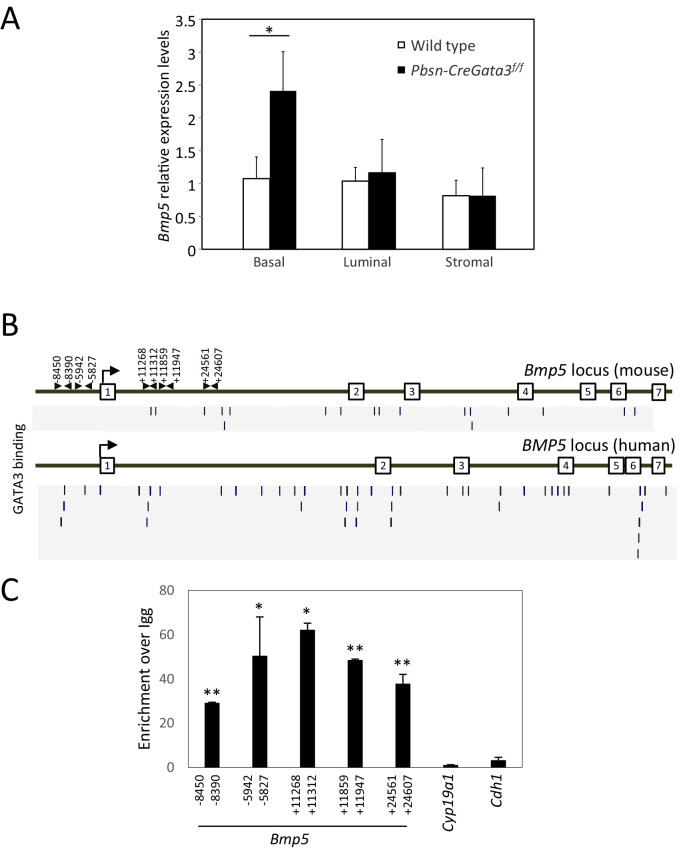
Figure 2—figure supplement 2. Bmp5 expression is specifically affected in Gata3-deficient basal cells.

Figure 2—figure supplement 2.

(A) The expression of Bmp5 in sorted basal, luminal and stromal cells from wild type and Pbsn-Cre Gata3f/f prostates. Relative expression levels normalized to Ppia and wild-type basal cells as assessed by quantitative RT-PCR (Average ± SD, n = 3), (two-tailed t-test as compared to wild-type condition; *p<0.0001). (B) ChIP-seq data from the Gene transcription regulation database (GTRD) showing regions of the Bmp5 (mouse, upper pannel) and BMP5 (human, lower pannel) locus bound by GATA3 protein. (C) Bmp5 locus is bound by GATA3 protein in prostate cells. Crosslinked extract from Gata3bio/bio Rosa26BirA/BirA prostate tissue were subjected to BioChIP pulldown and amplification of the indicated locus was done by quantitative PCR. Shown is the fold enrichment of streptavidin bead over Igg control beads (average ± SD, two-tailed t-test as compared to Cdh1 promoter; *p<0.001, **p<0.0001).
Figure 2—figure supplement 2—source data 1. Statistical analysis for Figure 2—figure supplement 2A.
Figure 2—figure supplement 2—source data 2. Statistical analysis for Figure 2—figure supplement 2C.
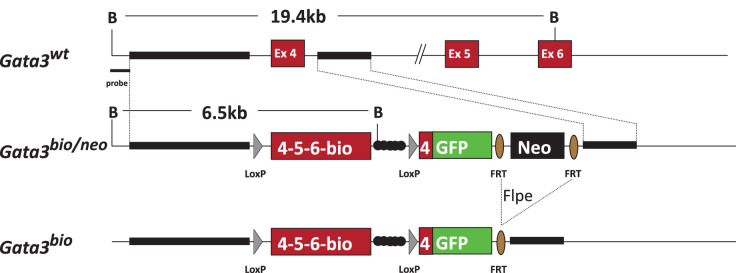
Figure 2—figure supplement 3. Generation strategy of Gata3bio allele.

Figure 2—figure supplement 3.