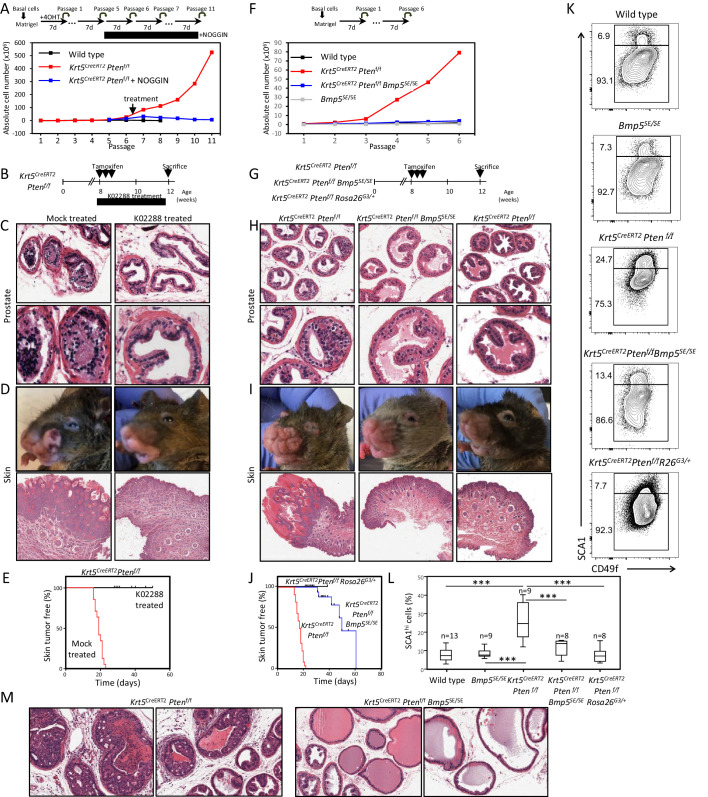
Figure 4. BMP inhibition reduces Pten-deficient propagation potential and inhibits skin and prostate tumor initiation.
(A) The aberrant organoid-forming capacity of Pten-deficient basal cells is abrogated by BMP inhibitor (NOGGIN) treatment. Cre activity was induced in vitro by treatment with hydroxy-tamoxifen for the first passage of organoid derived from basal cells of Krt5CreERT2Ptenf/f mice. From passage 5, organoids were cultured in presence or absence of NOGGIN. Organoid-forming potential was assessed as in Figure 1A. (B) Krt5CreERT2Ptenf/f tamoxifen-treated mice were injected with either K02288 or PBS for 4 weeks. (C–D) Representative histological sections of prostate tissue (C) and skin tissue (D) stained with H&E showing an absence of PIN and skin hyperplasia in K02288-treated as compared to mock-treated mice. (E) Kaplan-Meier skin tumor free survival curves of tamoxifen-induced Krt5CreERT2Ptenf/f treated or not with K02288 (log-rank (Mantel-Cox) test; p<0.0001, n = 7 and n = 14, respectively). Tick-marks represent sacrificed animals. (F) Bmp5 loss rescues the aberrant organoid-forming capacity of Pten-deficient basal cells. Cre activity was induced in vivo by tamoxifen injection in adult mice 4 weeks prior to organoid propagation potential assessment. (G–L) Eight-week-old mice were treated with tamoxifen and sacrificed 4 weeks later. (H–I) Bmp5 loss and Gata3 overexpression rescues Pten-deficient prostate and skin hyperplasia. Shown are representative H&E pictures of prostate (H) and skin (I) tissues. (J) Kaplan-Meier skin tumor free survival curves of tamoxifen-induced Krt5CreERT2Ptenf/f, Krt5CreERT2Ptenf/fBmp5SE/SE and Krt5CreERT2Ptenf/fRosa26G3/+ mice (log-rank (Mantel-Cox) test; p<0.0001, n = 22, n = 17 and n = 9, respectively). Tick-marks represent sacrificed animals. (K–L) Representative FACS phenotype (K) and percentage of SCA1hi cells (L) in the luminal compartment as defined by Lin(CD45, CD31, TER119)-EpCAM+CD49fMed of total prostate (one-way ANOVA; ***p<0.0001). (M) Representative H&E pictures of prostate tissues of Krt5CreERT2Ptenf/f and Krt5CreERT2Ptenf/fBmp5SE/SE mice sacrificed 9 weeks after tamoxifen treatment. See also Figure 4—figure supplements 1,2.
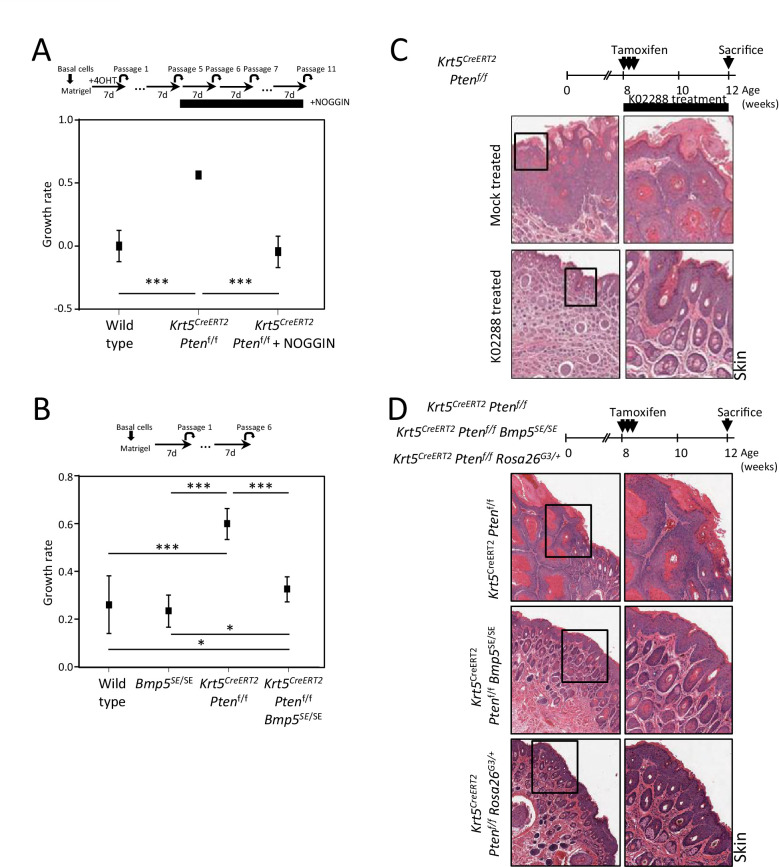
Figure 4—figure supplement 1. BMP inhibition corrects Pten-deficient tumor phenotypes.
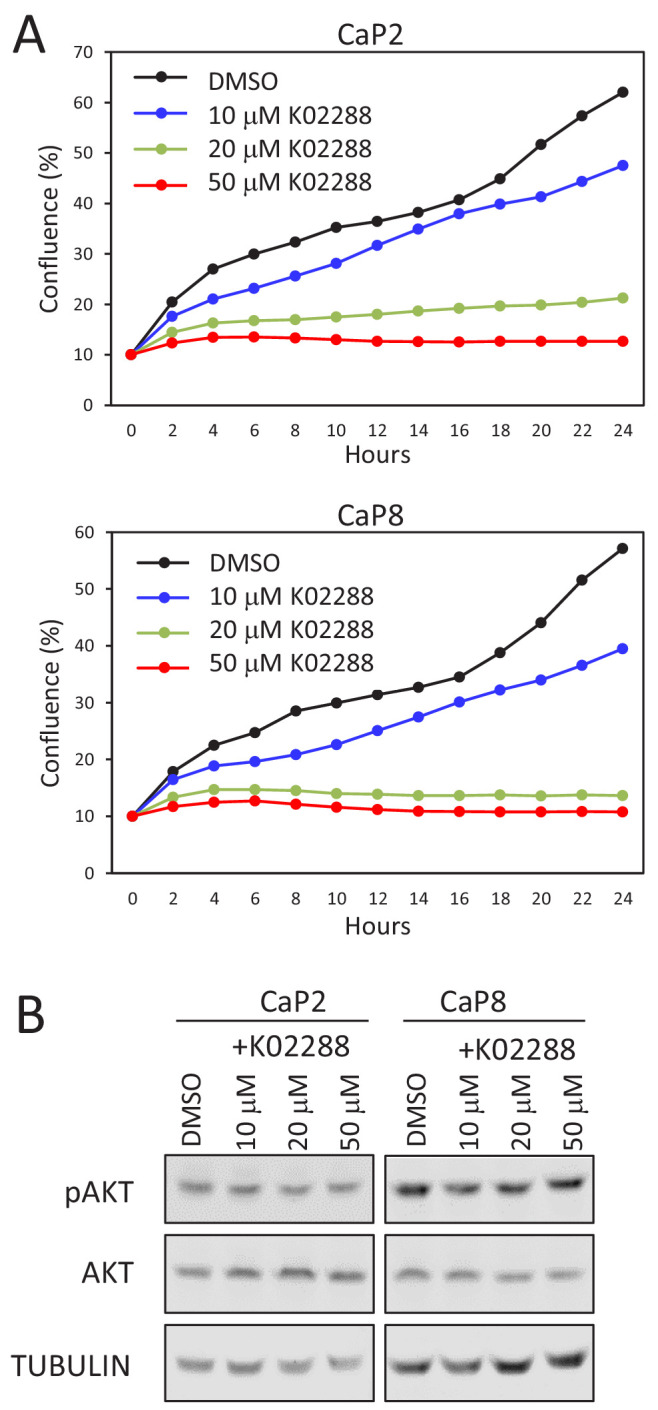
Figure 4—figure supplement 2. K02288 acts downstream of AKT pathway.


