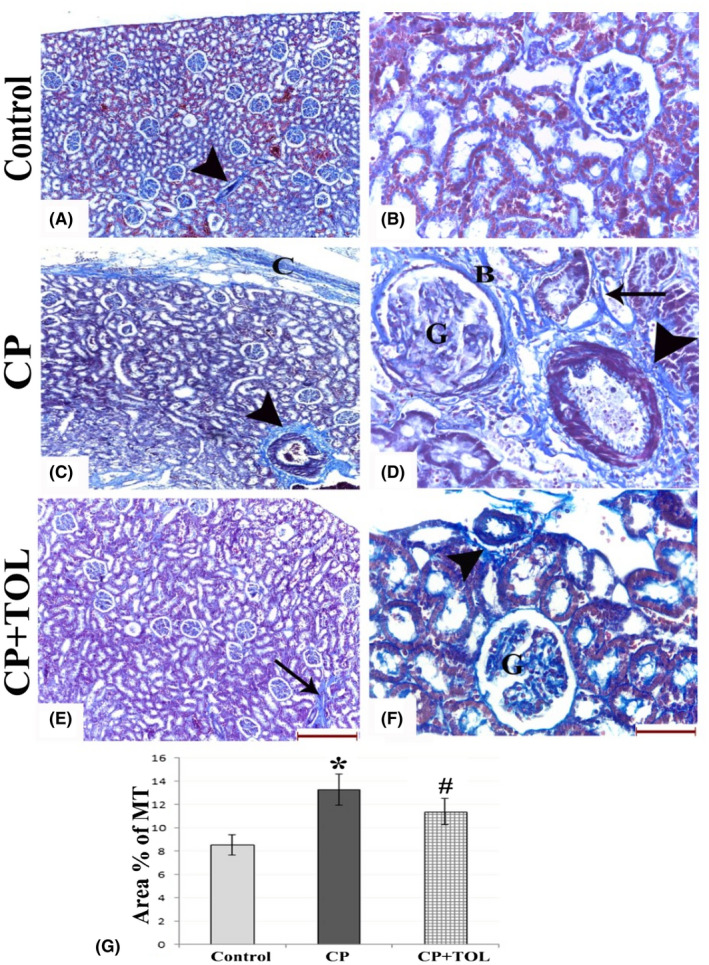
FIGURE 2.

MT‐stained sections of (A,B) control group showing normal glomerular, interstitial, and perivascular (arrow head) collagen, (C,D) CP‐treated group showing increased capsular thickening (C) and dens deposition of collagen bundles around the blood vessels (arrow heads), around the tubules (arrow), in the Bowman's capsules (B), and within the glomeruli (G) with capillary to capsule adhesion. (E,F) CP + TOL‐treated group showing few collagen fibers within the glomeruli (G), around blood vessels (arrow head), and tubules (arrow). (G) Graph showing area percent of collagen deposition in different groups; data are presented as mean ± standard deviation, *: statistically significant relative to control group, #: statistically significant relative to CP group at P > .05 using ANOVA, Bonferroni post hoc pairwise comparison (n = 3; (a,c,e: scale bar 200 µm, b,d,f: scale bar 50 µm)
