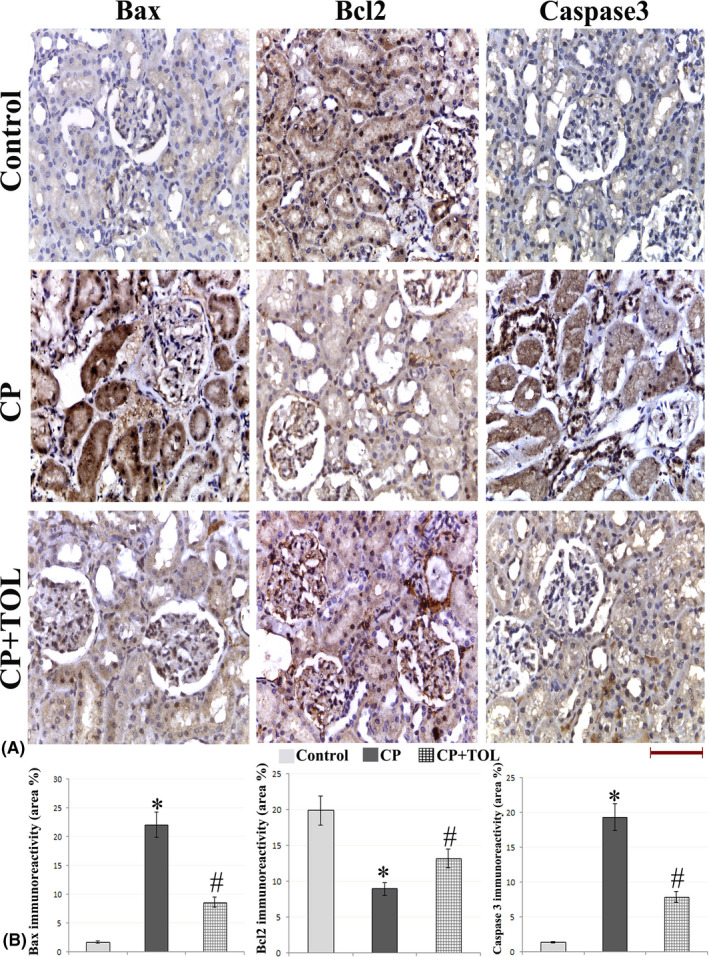
FIGURE 4.

(A) Representative figures of Bax, Bcl‐2, and caspase‐3 immunohistochemical expression in the different study groups (g) Area percent of immunoreactivity of Bax, Bcl‐2, and caspase‐3 (n = 3); data are presented as mean ± standard deviation, *: statistically significant relative to control group, #: statistically significant relative to CP group at P > .05 using ANOVA, Bonferroni post hoc pairwise comparison (scale bar 50 µm)
