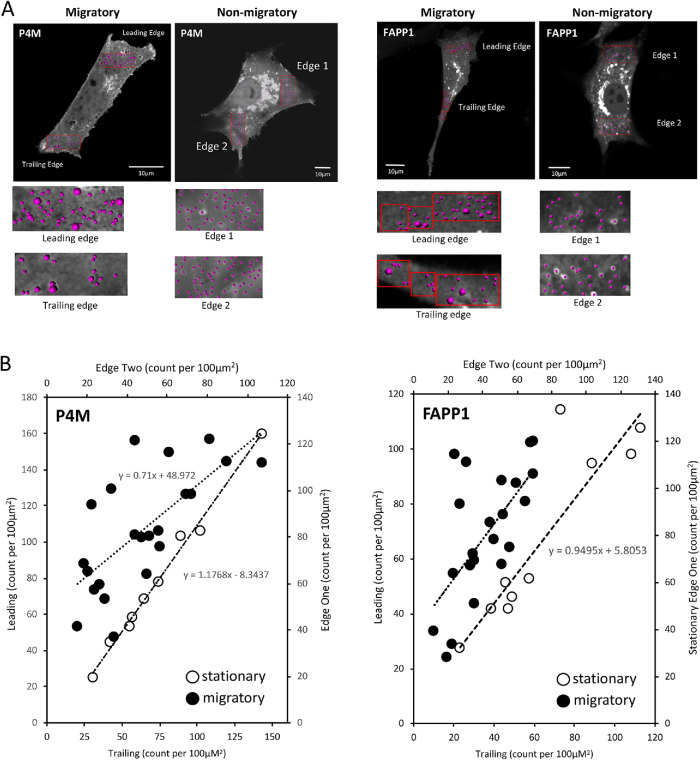
FIGURE 2:
PI4P containing vesicles have polarized distribution in migrating cells. (A) PI4P-containing vesicles are visualized in NIH3T3 fibroblasts that are either migratory (leading and trailing edges indicated) or nonmigratory. Vesicles are counted by volume rendering in Imaris. (B) The number of PI4P vesicles, either P4M or FAPP1 labeled, at the leading edge is plotted as a function of the vesicles at the trailing edge in migratory cells (•). For nonmigratory cells, the number of vesicles is plotted for two opposite edges (o). The line of best fit is shown.

