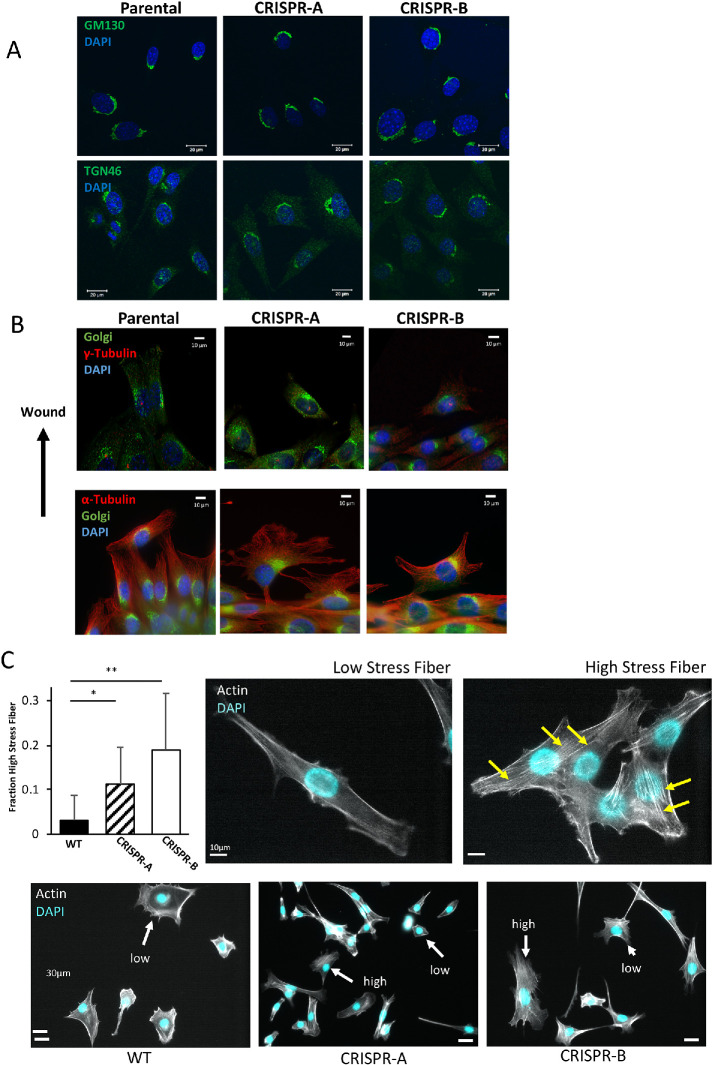
FIGURE 4:
Loss of PI4KIIIβ alters stress fiber appearance. (A) Cis- and trans-Golgi structure as visualized by GM130 and TGN46 staining, respectively, in WT NIH3T3 cells and two independent lines of PI4KIIIβ-deleted cells. (B) Golgi, centrosome (γ-tubulin) and microtubule (α-tubulin) structure visualized in cells entering a scratch wound. (C) CRISPR cell lines both show significantly (t test, p < 0.0001) more cells with high numbers of stress fibers compared with WT cells. Representative cells with respectively low or high numbers of stress fibers (yellow arrows) are shown in the right panels. Bottom panels show representative fields of WT and CRISPR lines showing cells with high or low stress fiber content.

