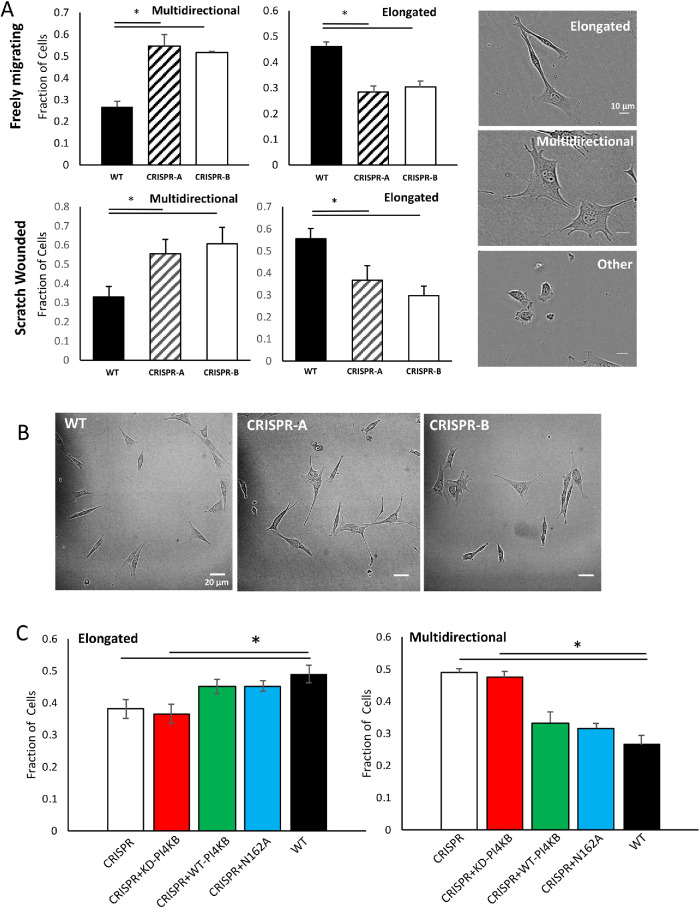
FIGURE 5:
Loss of PI4KIIIβ alters cell shape distribution. (A) Two independent lines of PI4KIIIβ-deleted cells have different population shape distributions (depicted in the right panels) in both freely migrating conditions and in the wound of a scratch. The fraction of elongated cells in either line of CRISPR cells is significantly (p < 0.001, t test) lower than in a population of WT cells. Similarly, the fraction of elongated cells in either line of CRISPR cells is significantly (p < 0.001, t test) higher than in a population of WT cells. Results are the mean and SD of triplicate independent measurements of at least 200 cells each from a minimum of 20 randomly selected fields (B) Representative fields of each cell type. Scale bar is 20 μm. (C) Re-expression of either WT- or N162A-PI4KIIIβ restores elongated and multidirectional shape distribution to the CRISPR cells. Expression of KD-PI4KIIIβ does not rescue cell shape changes and their elongated of multidirectional composition is similar to the CRSPR control and significantly different from WT cells (p < 0.05, t test). Results are the mean and SD of quadruplicate independent measurements of at least 200 cells from at least 20 randomly selected fields (D) Distance traveled over time was monitored for 50 WT NIH3T3 cells with either elongated or multidirectional morphologies. Tracks for 10 cells of each type are shown. Multidirectional cells have a significantly reduced average angular rotation that elongated cells (p < 0.05, t test). (E) Quantification of migration patterns in WT cells with either multidirectional or elongated morphologies. Mean angular rotation or velocity is presented as the mean and SD of 50 cells collected over at least 30 min. Angular rotation is significantly lower in the multidirectional population compared with the elongated one (p < 0.05, t test). Comparison between Angular Rotation and Velocity between WT and CRISPR lines. Mean angular rotation or velocity is presented as the mean and SD of 50 cells collected over at least 30 min.

