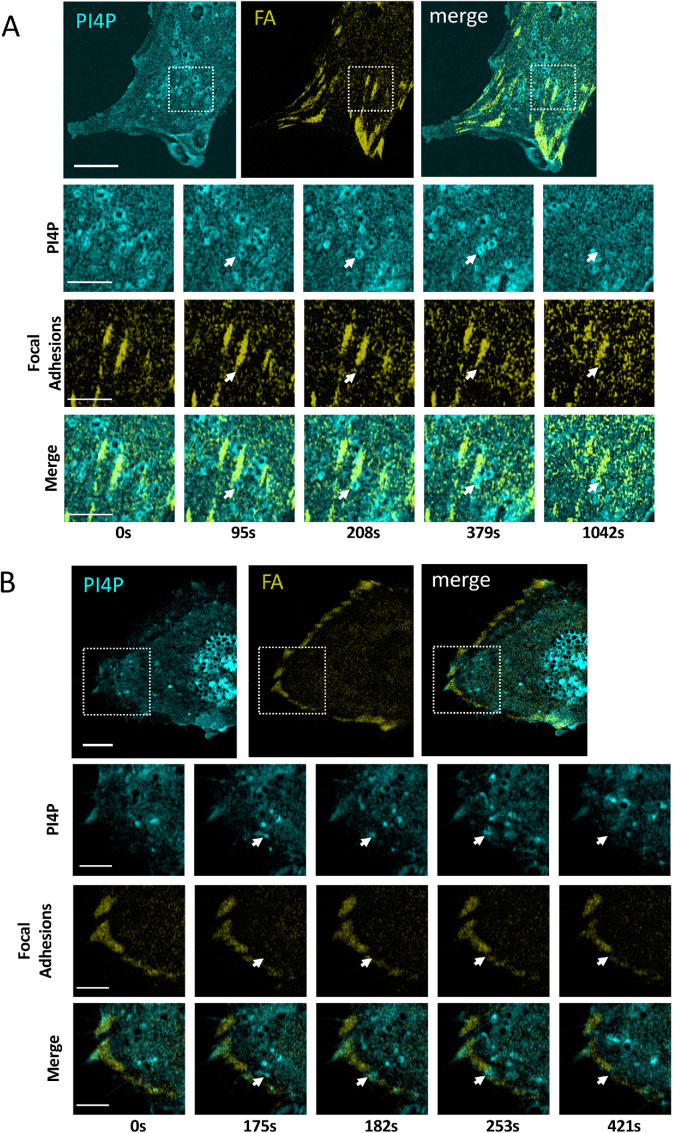
FIGURE 6:
PI4P Vesicles move to and fuse with FAs. (A) Visualization of PI4P and FAs in the leading edge of a migrating NIH3T3 cells. The time series indicates a single vesicle observed from the boxed inset. The fusing vesicle (white arrow) appears at 95 s. Scale bar in the large image is 10 μm and is 3 μm in the enlarged images. (B) Visualization of PI4P and FA in the trailing edge of a migrating NIH3T3 cells. The time series indicates a single vesicle seen from the boxed inset. The fusing vesicle (white arrow) appears at 175s. Scale bar in the large image is 10 μm and is 3 μm in the enlarged images. (C) BLLSM imaging of PI4P vesicles (green P4M reporter) fusing with FA (red Vinculin reporter) in a migrating cell. Histogram shows that the majority of fusions events (n = 50) cause FA destruction within 3–6 s. The bottom panels show enlarged fields of the top panel where two fusion events, one causing FA destruction and the other not, can be seen.

