FIGURE 1:
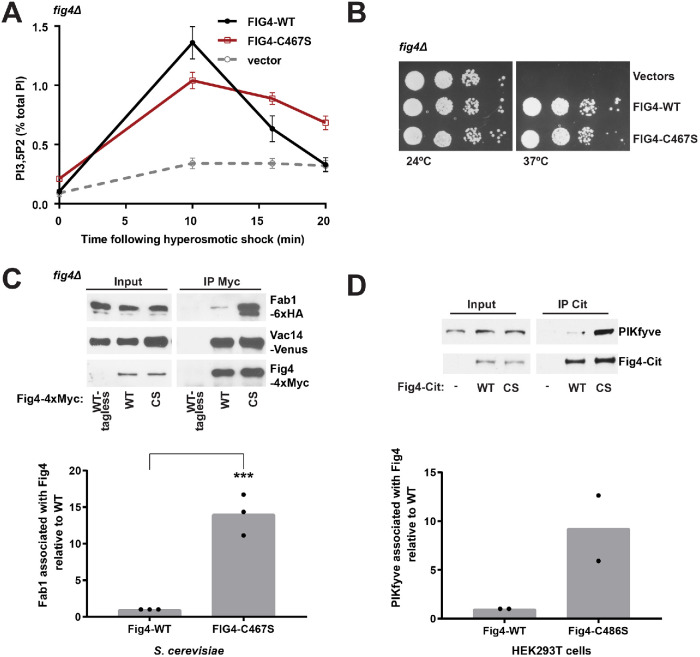
Catalytically impaired Fig4 supports partial Fig4 function. (A) PI3,5P2 was analyzed by HPLC from fig4Δ cells labeled with [3H]inositol. NaCl (0.9 M) was added to the media at 0 time. The hyperosmotic shock–induced rise in PI3,5P2 (10 min levels minus basal levels) is decreased by 33 ± 1% in Fig4-C467S compared with Fig4-WT (p = 0.0022, two-tailed t test). Basal levels of PI3,5P2 are 2.1± 0.4-fold higher in Fig4-C467S relative to wild type (p = 0.0082, two-tailed t test). Mean of four independent experiments. Error bars: SD. (B) Catalytically impaired Fig4 substitutes for wild-type Fig4 to support growth at 37°C in a fig4Δ Vac14-Venus Fab1-TAP strain. Cells expressing no Fig4, Fig4-wild-type (WT), or catalytically impaired Fig4 (C467S) from a plasmid were grown on selective SC–leu plates at 24° and 37°C. (C) Western blot of proteins immunoprecipitated with anti-Myc antibody from a fig4Δ strain expressing Fig4-4xMyc wild-type (WT-Myc), C467S (CS-Myc), or untagged Fig4 wild-type (WT-tagless) from a plasmid with native 5′ and 3′ UTR. Vac14-Venus and Fab1-6xHA expressed from endogenous loci. (D) Western blot of proteins immunoprecipitated with anti-Citrine antibody from HEK293T cells transfected with Fig4-Citrine, Fig4-C486S-Citrine, or Citrine alone. Bar graphs show quantification of Western blots in C and D. In yeast, Fab1 association with Fig4 C467S is 14.06 ± 2.81 times higher than wild-type Fig4, normalized to Fig4. Data points and mean of three independent experiments (** p = 0.0006, two-tailed t test). In HEK293T cells, PIKfyve association with Fig4 C486S is 9.27 ± 4.75-fold higher relative to wild-type Fig4. Data points and mean from two independent experiments.

