FIGURE 3:
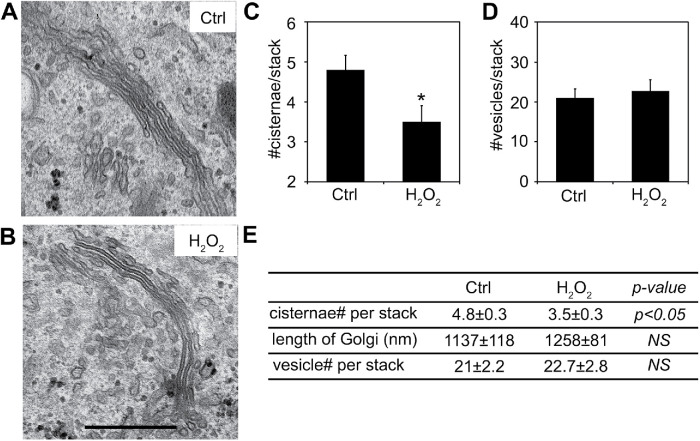
H2O2 treatment reduces the number of cisternae per Golgi stack. (A, B) Representative electron micrographs of Golgi profiles in HeLa cells either untreated (Ctrl; A) or treated with 1 mM H2O2 for 10 min (H2O2; B). Note that the Golgi stacks contain fewer cisternae in the H2O2 treatment compared with Ctrl cells. Scale bar = 0.5 µm. (C, D) Quantitation of Golgi stack morphological features of cells in A and B. (E) Summary of quantitation of the morphological features of Golgi stacks on the EM images represented in A and B. Results are shown as mean ± SEM; statistical analyses were performed using two-tailed Student’s t tests (*, p ≤ 0.05; NS, not significant).

