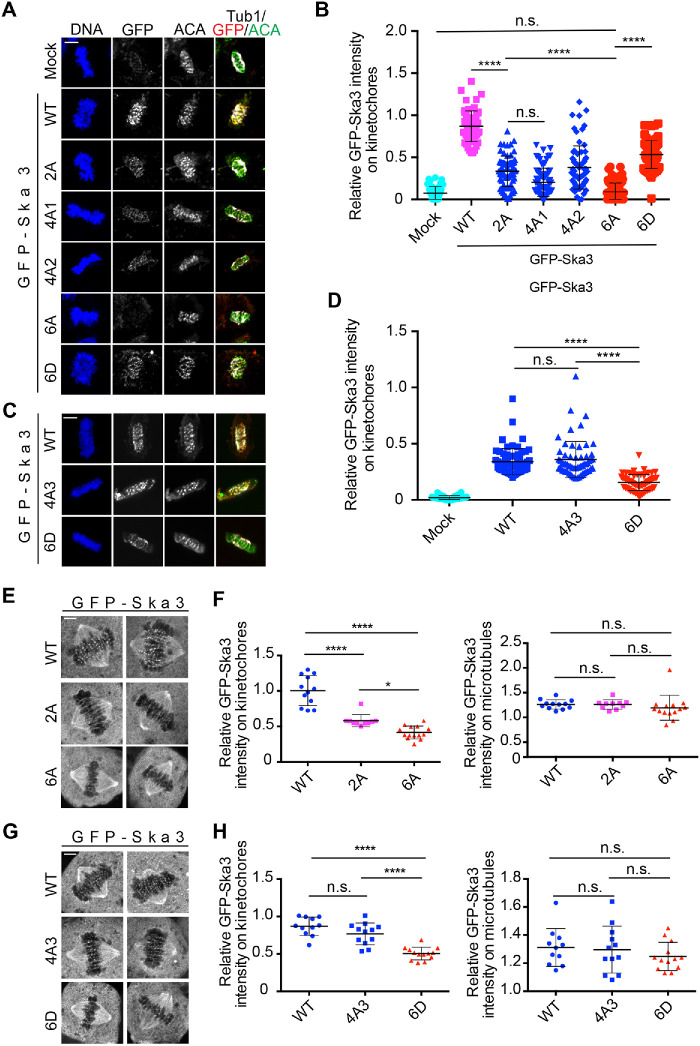
FIGURE 2:
Cdk1 phosphorylation in Ska3 is essential for Ska localization at kinetochores. (A) Thymidine-arrested HeLa Tet-On cells expressing GFP-Ska3 WT, 2A, 4A1/2, 6A, or 6D were released into fresh medium. Mitotic cells were collected for immunostaining using the indicated antibodies. Representative images were shown here. Scale bars, 5 μm. (B) Quantification of in GFP-Ska3 intensity on kinetochores in A. Detailed description about quantification was recorded in Materials and Methods section. At least 60 kinetochores (6 kinetochores per cell) were analyzed for each condition. Average and SD were shown in lines. ****P < 0.0001; n.s. denotes no significance. (C) Cells expressing GFP-Ska3 WT, 4A3, or 6D were treated similarly to the ones in A. Scale bars, 5 μm. (D) Quantification of GFP-Ska3 intensity on kinetochores in C. At least 60 kinetochores (6 kinetochores per cell) were analyzed for each condition. Average and SD were shown in lines; n.s. denotes no significance. (E, G) Live-cell imaging of HeLa Tet-On cells expressing GFP-Ska3 WT, 2A (E), 6A (E), 4A3 (G), or 6D (G) treated with MG132 for 1 h. Scale bars, 5 μm. (F, H) Quantification of GFP-Ska3 intensity on kinetochores (left panel) and microtubules (right panel) in E and G were normalized to that of cytoplasm. Detailed description about quantification was recorded in Materials and Methods section. For both F and H, at least 10 cells (10 kinetochores and 10 microtubules per cell) were analyzed for each condition. Average and SD were shown in lines. *P < 0.05; ****P < 0.0001; n.s. denotes no significance.

