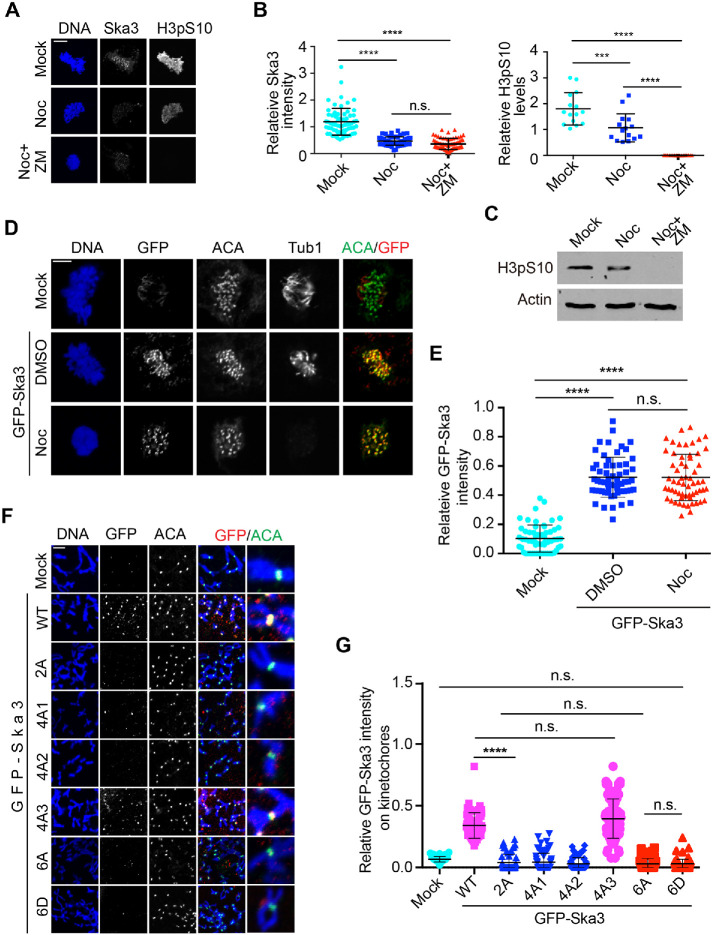
FIGURE 3:
Spindle microtubules facilitate Ska recruitment to kinetochores. (A) Aurora B kinase activity is dispensable for Ska3 localization at kinetochores. Thymidine-arrested HeLa Tet-On cells were released into fresh medium. At 7 h after release, nocodazole with a final concentration of 5 μM was added. Aurora B inhibitor ZM447439 (ZM) was then added 2 h later. Mitotic cells with 1-h ZM treatment were collected for staining with DAPI and the indicated antibodies. (B) Quantifications of Ska3 intensity (left) and H3pS10 intensity (right) on kinetochores in A. Detailed description about quantification was recorded in Materials and Methods section. At least 60 kinetochores (6 kinetochores per cell) were analyzed for each condition. Average and SD were shown in lines. ****P < 0.0001; ***P < 0.001; n.s. denotes no significance. (C) Cell lysates in A were separated with SDS–PAGE and then blotted with the indicated antibodies. (D) Ska3 overexpression overrides the effects of nocodazole on its kinetochore localization. HeLa Tet-On cells transfected with plasmids containing GFP-Ska3 were treated with DMSO or nocodazole. Mitotic cells were collected for staining with DAPI and the indicated antibodies. (E) Quantification of GFP-Ska3 intensity on kinetochores in D. Only prometaphase cells were selected for analysis. Detailed description about quantification was recorded in Materials and Methods section. At least 60 kinetochores (6 kinetochores per cell) were analyzed for each condition. Average and SD were shown in lines. ****P < 0.0001; n.s. denotes no significance. (F) HeLa Tet-On cells were treated under the same conditions described in Figure 2A, except that nocodazole was added at 7 h after thymidine release. Scale bars, 5 μm. (G) Quantification of GFP-Ska3 intensity on kinetochores in F. Detailed description about quantification was recorded in Materials and Methods section. At least 60 kinetochores (6 kinetochores per cell) were analyzed for each condition. Average and SD were shown in lines. ****P < 0.0001; n.s. denotes no significance.

