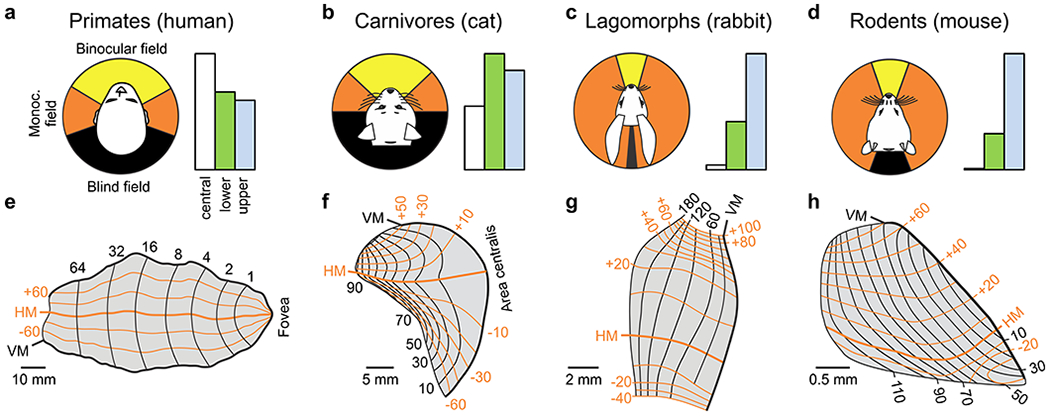
Figure 6. Cortical map for retinotopy.

a-d. Visual fields and their cortical representation in humans (a), cats (b), rabbits (c) and mice (d). The left panel shows the binocular field (yellow), monocular field (orange) and the blind field (black). Values from (Mazade & Alonso 2017). The right panel shows the percentage of area V1 devoted to central vision (white, central 10 degrees), lower (green) and upper visual fields (blue). Percentages of blue bars are 26% (a), 36% (b), 69% (c), and 76% (d). Values obtained from retinotopic maps in e-h. e-h. Retinotopic maps of area V1 in the human, cat, rabbit and mouse. Redrawn from (Adams et al 2007) for a, (Tusa et al 1978) for b, (Hughes 1971) for c, and (Ji et al 2015) for d.
