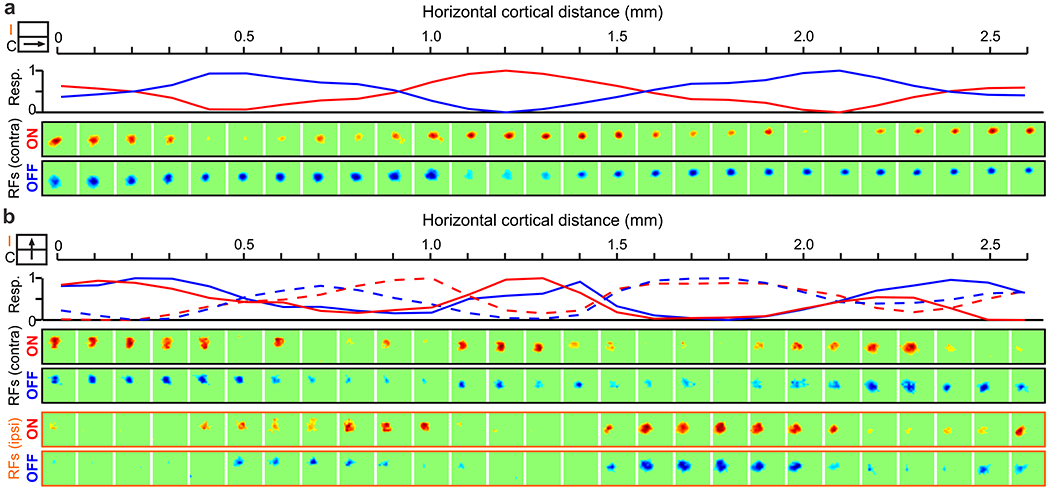
Figure 8. Cortical map for light/dark polarity.

a. ON and OFF domains in a horizontal cortical track running along the length of an ocular dominance column (illustrated by cartoon in inset). From top to bottom, line plot showing normalized maximum ON (red) and OFF responses (blue), and receptive fields measured with light (ON) and dark stimuli (OFF). b. ON and OFF domains in a horizontal track running orthogonal to ocular dominance columns (inset). From top to bottom, normalized ON and OFF responses from contralateral (continuous lines) and ipsilateral eyes (dashed lines), and receptive fields mapped with dark and light stimuli from the contralateral eye (black frame) and ipsilateral eyes (orange frame). Reproduced from (Kremkow et al 2016).
